The Independent
Vanguard Fund Analyzer
Possibly the most comprehensive Vanguard research tool ever built
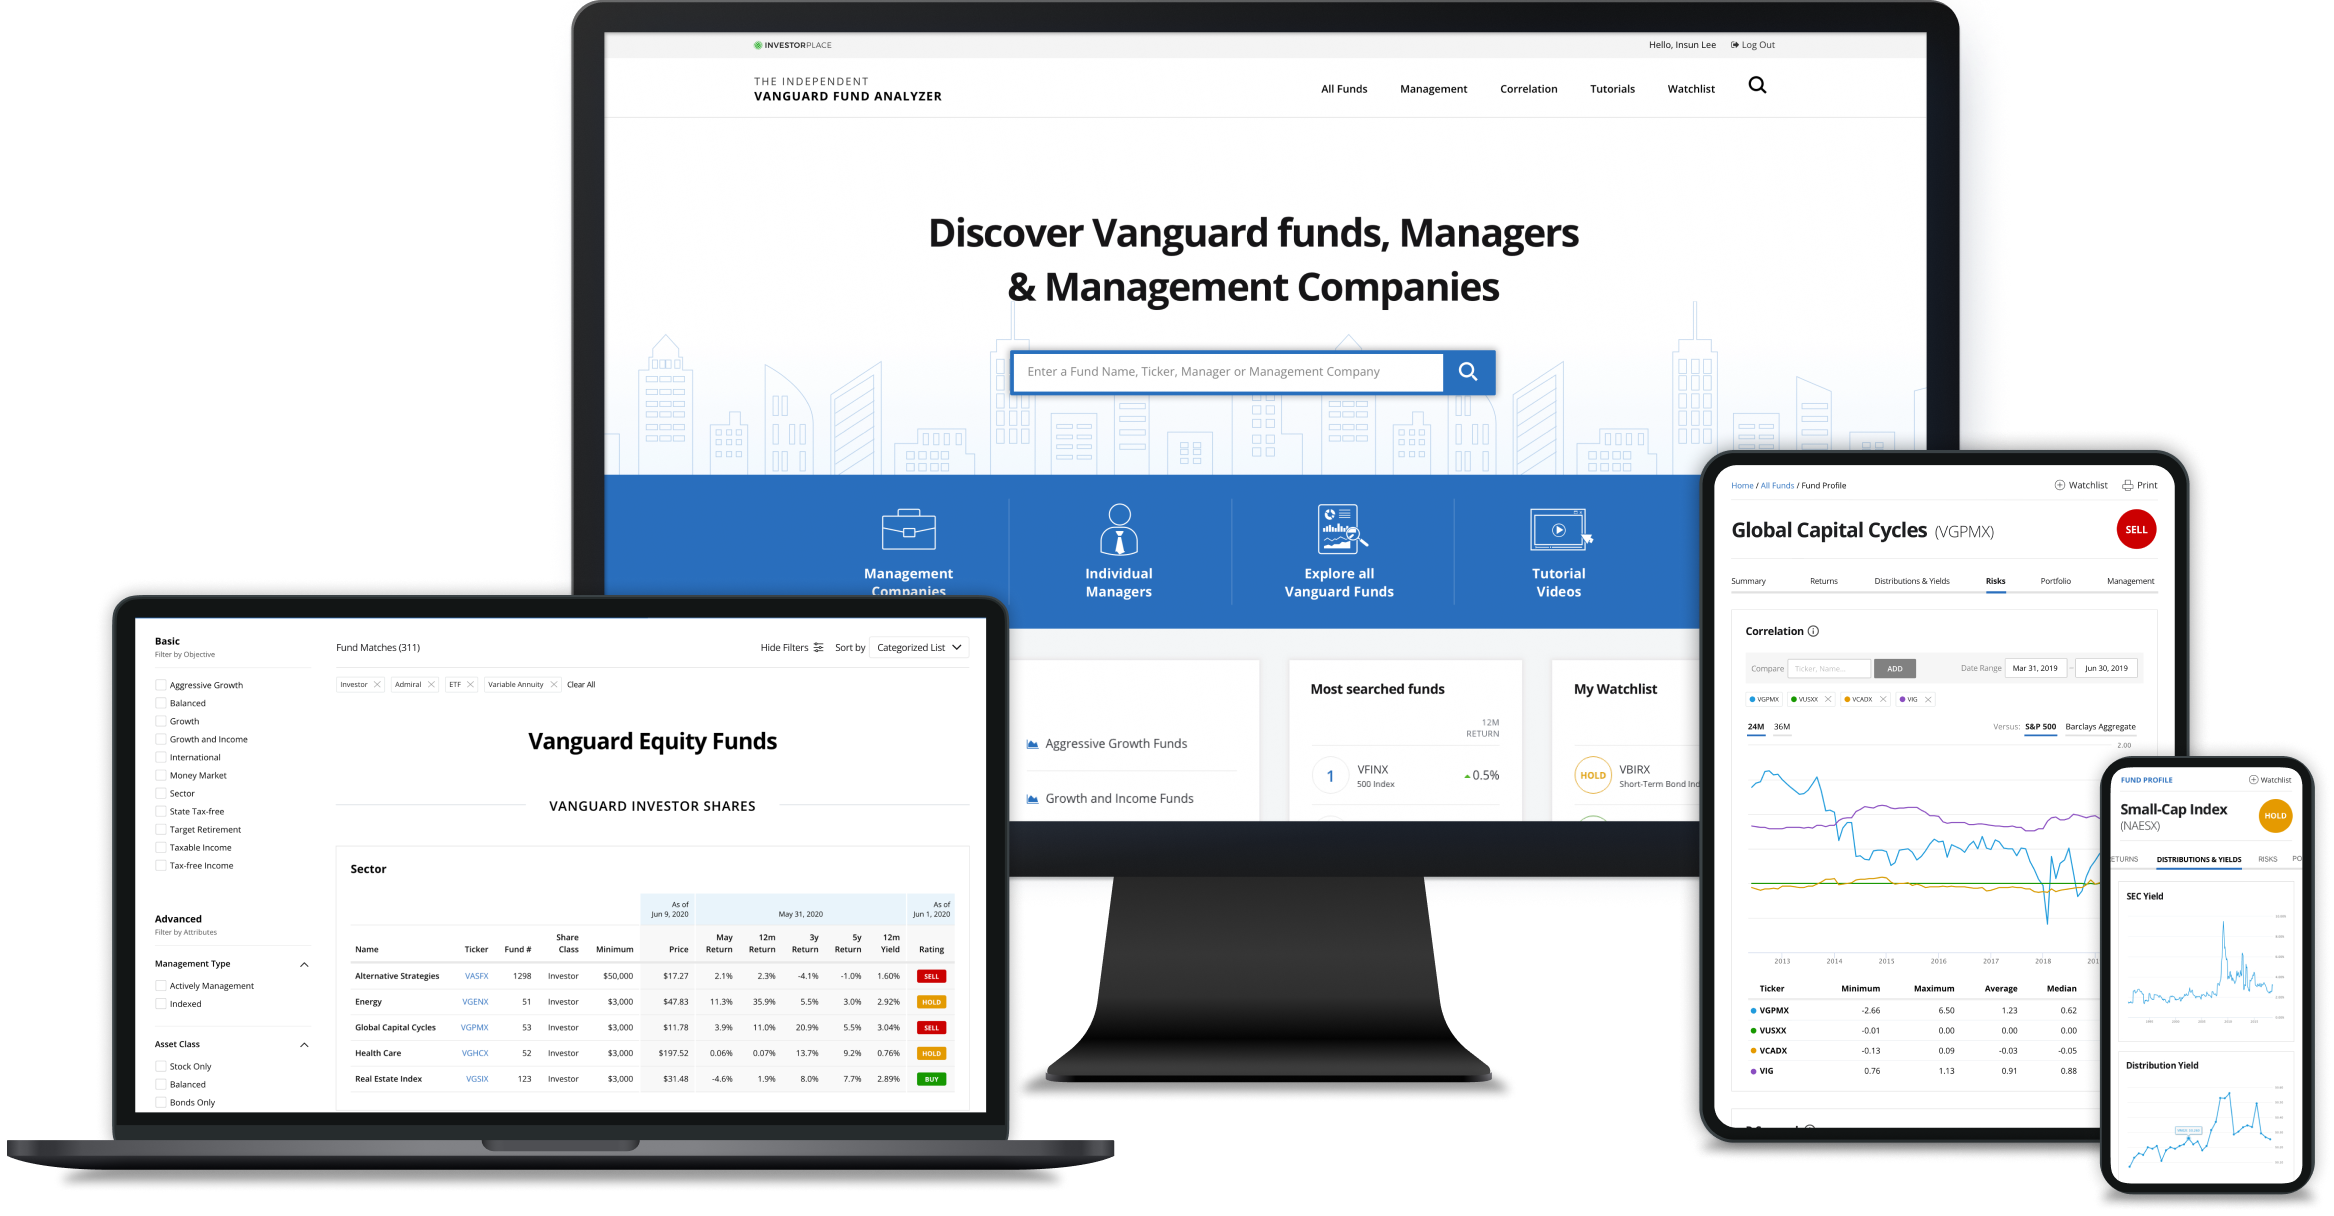
Project Overview
The 'Independent Guide to Vanguard Funds' is an annual publication offering comprehensive analyses of each Vanguard fund and ETF. Responding to overwhelming customer demand for an online version of the guidebook, we transitioned it into a subscription-based online product. I led the transformation of this guidebook into a user-friendly online platform.

'Independent Guide to Vanguard funds' book
Project Goals
Existing guidebook readers
Seamless transition from a paper book to online.
New subscribers
Drive more subscriptions by providing a simple, easy-to-use experience.
Results
9 months post-rollout
Quarterly renewal rate of 81%
Subscription revenue has risen by 12%
My Role
As lead designer, I oversaw the entire design process for the project. This encompassed UI/UX design, visual design, and prototyping for both mobile and desktop platforms.
Responsibilities
Responsibilities
Responsibilities
Responsibilities
Responsibilities
User Research
User Experience Design
User Interface Design
Visual Design
Prototyping
Process
Discovery
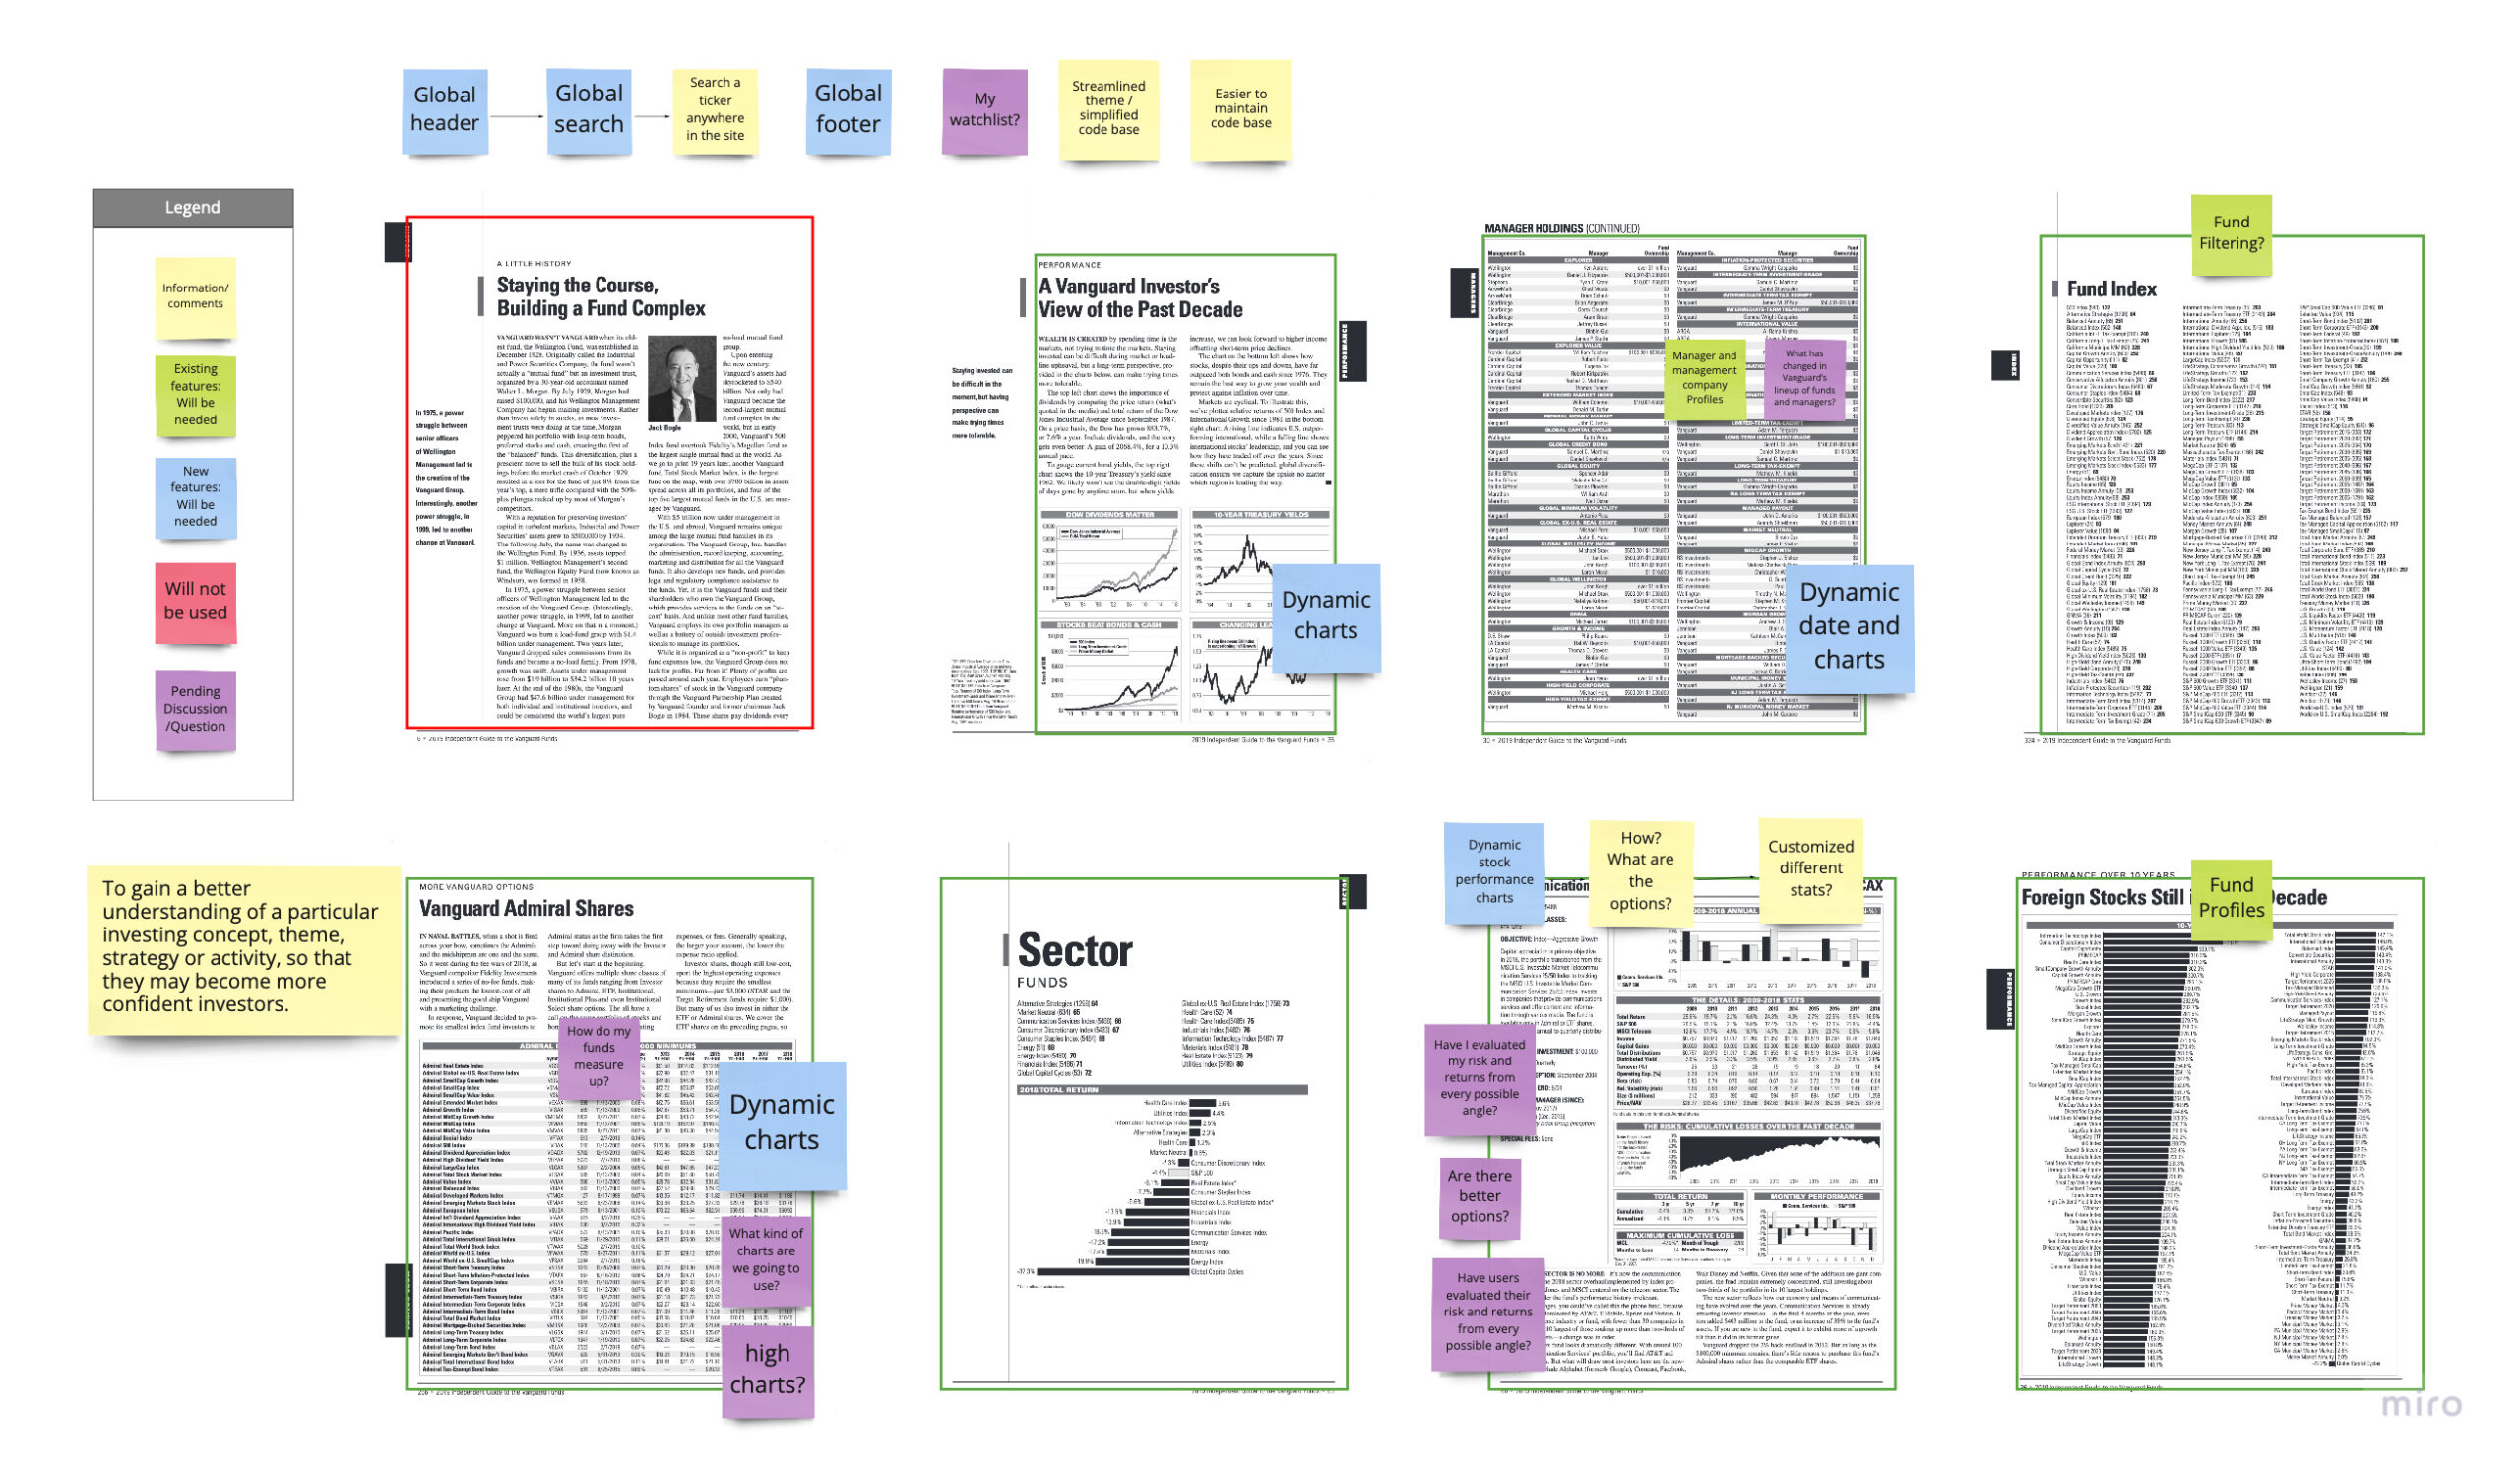
Before diving into design, I analyzed each page of the existing guidebook to identify design requirements and brainstorm potential solutions.
Key Findings
Difficulty in locating specific funds, managers, and companies
Users must look through specific funds, managers, and management companies on the index page. It is a cumbersome and time-consuming process.
The overwhelming complexity of data-heavy content in a limited book format
The book's constrained format led to small text, a busy layout, and compressed charts, overwhelming readers.
Lack of real-time data interaction
Static charts, graphs, and tables hinder users from accessing real-time data, limiting the availability of up-to-date information.
Key Solutions
Implement an advanced search feature for quick information access
Offer a master list of Vanguard funds with customizable filters
Maintain a clean and minimal interface for enhanced user focus
Transform static data into interactive elements
Process
User Flow & Low Fidelity Wireframe
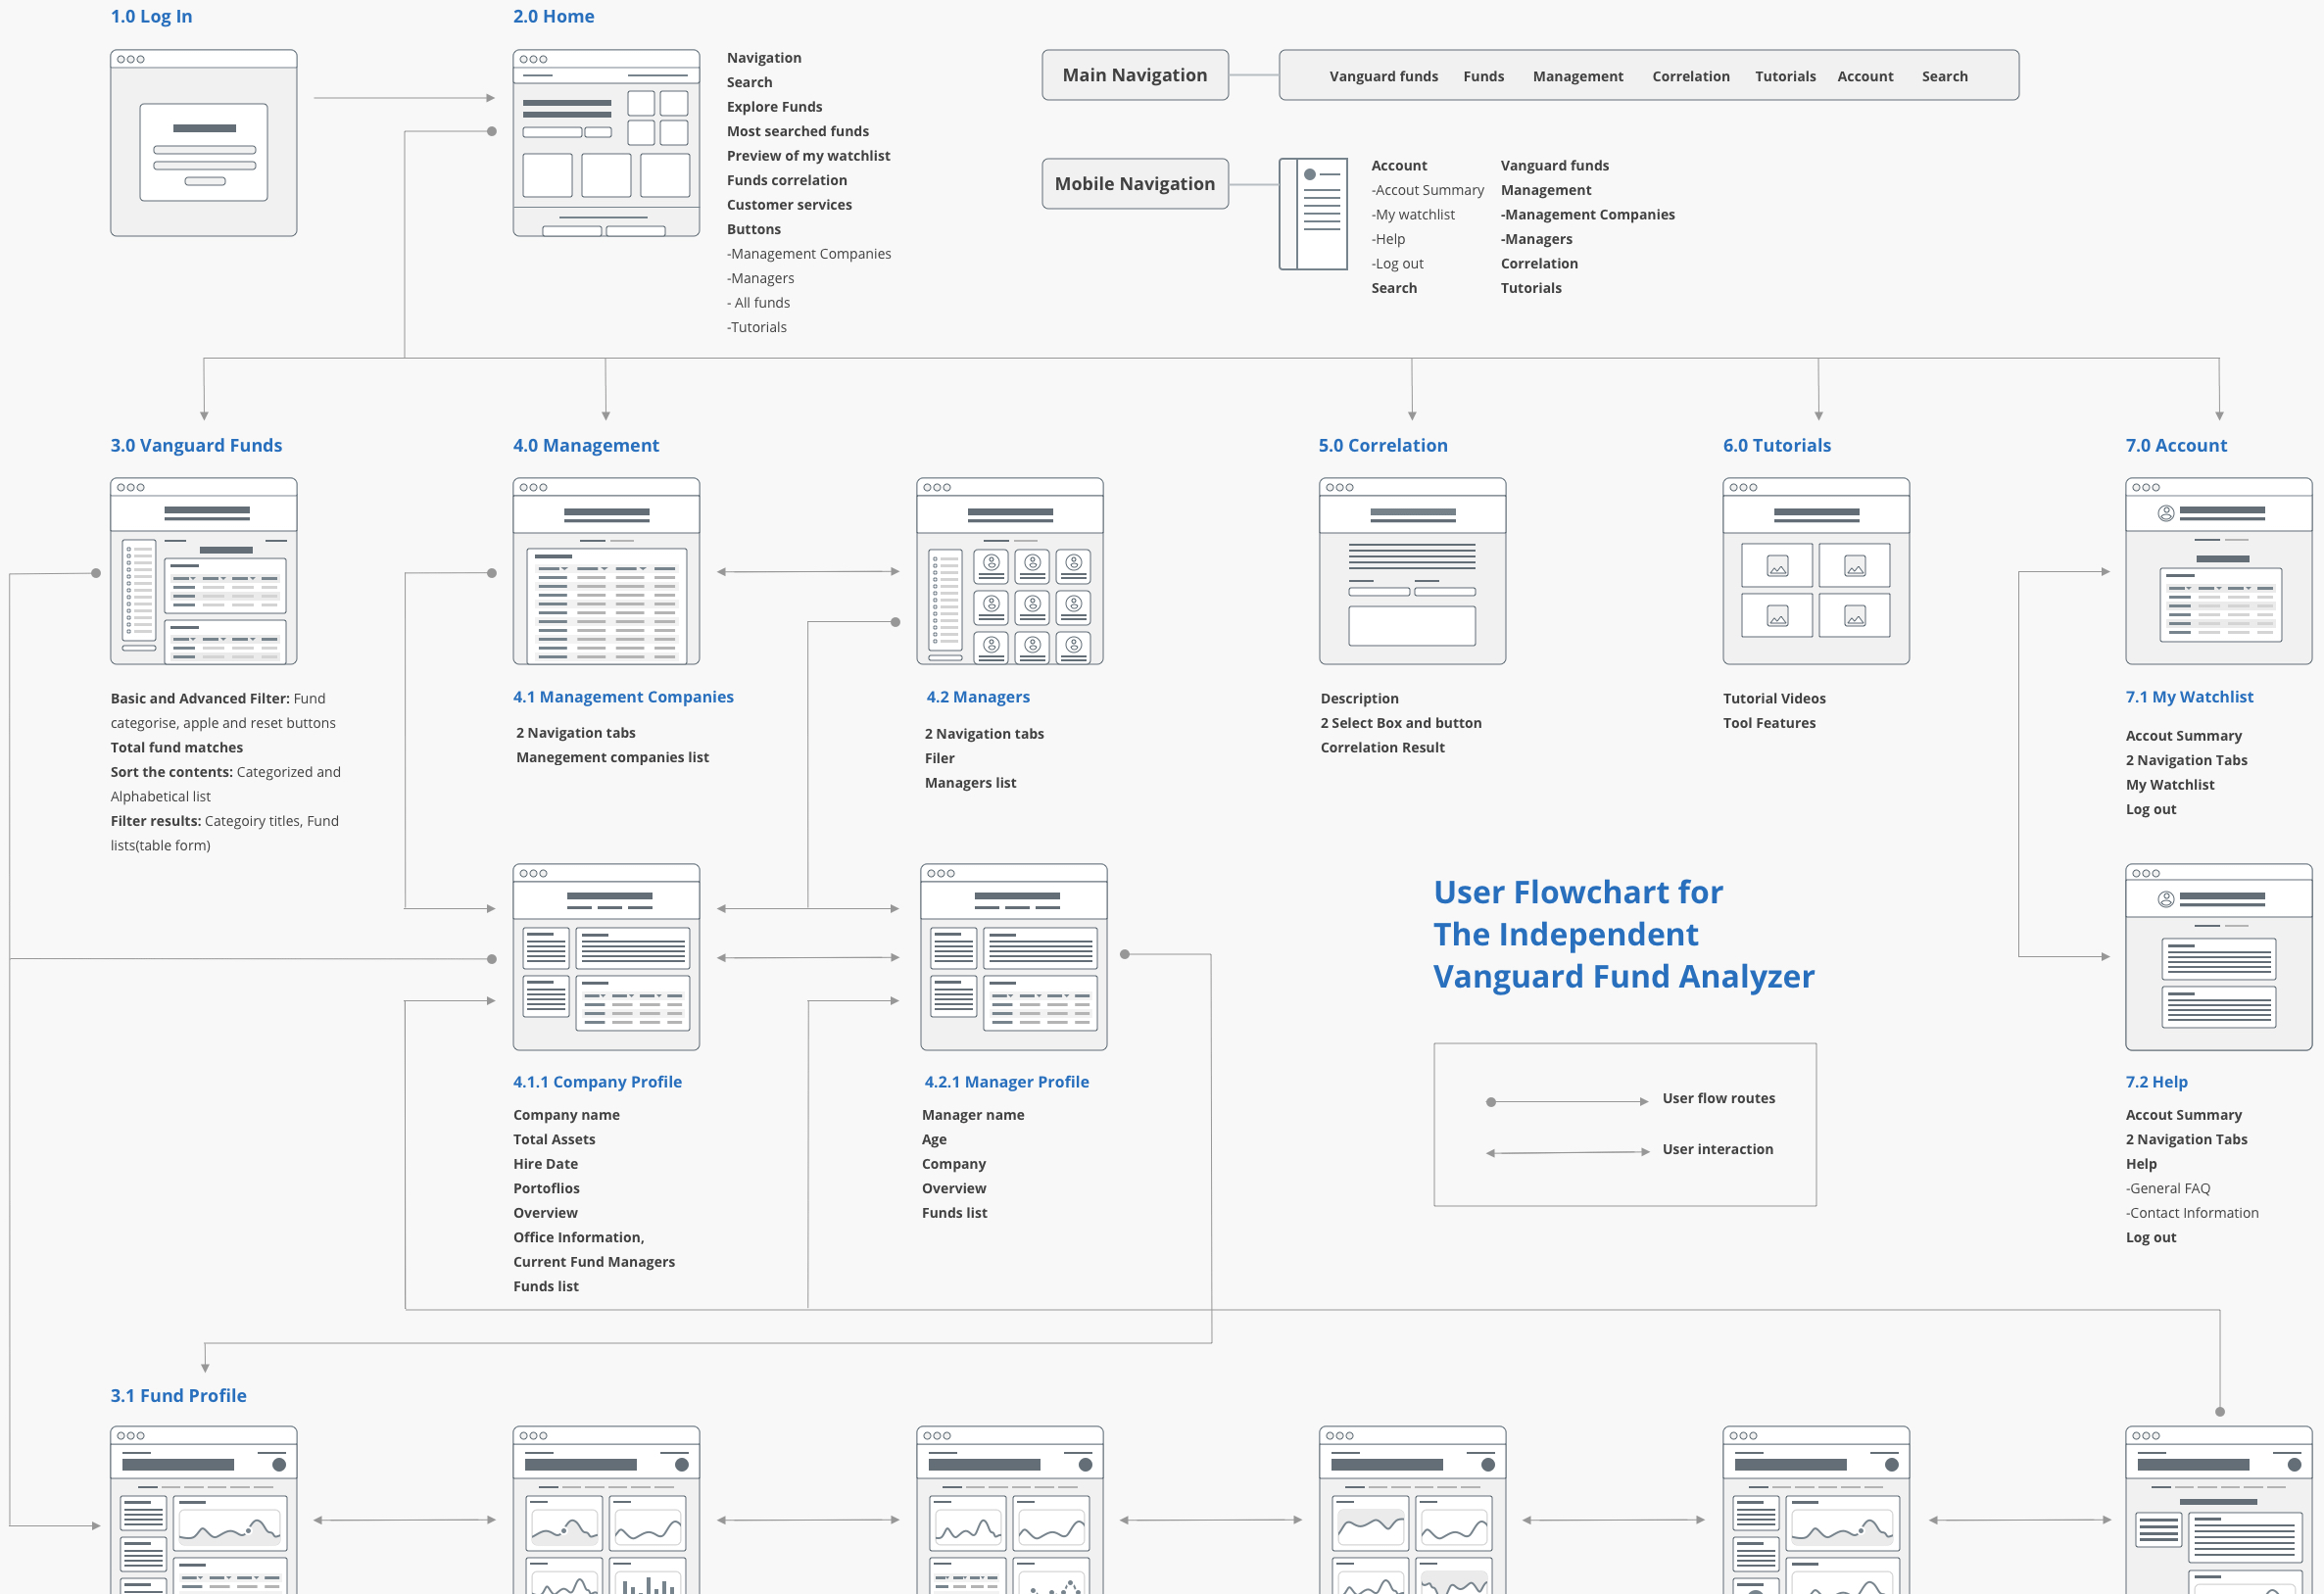
I created low-fidelity wireframes and user flows to validate and align site navigation.
1. Key solution
Streamlining Information Access with Advanced Search
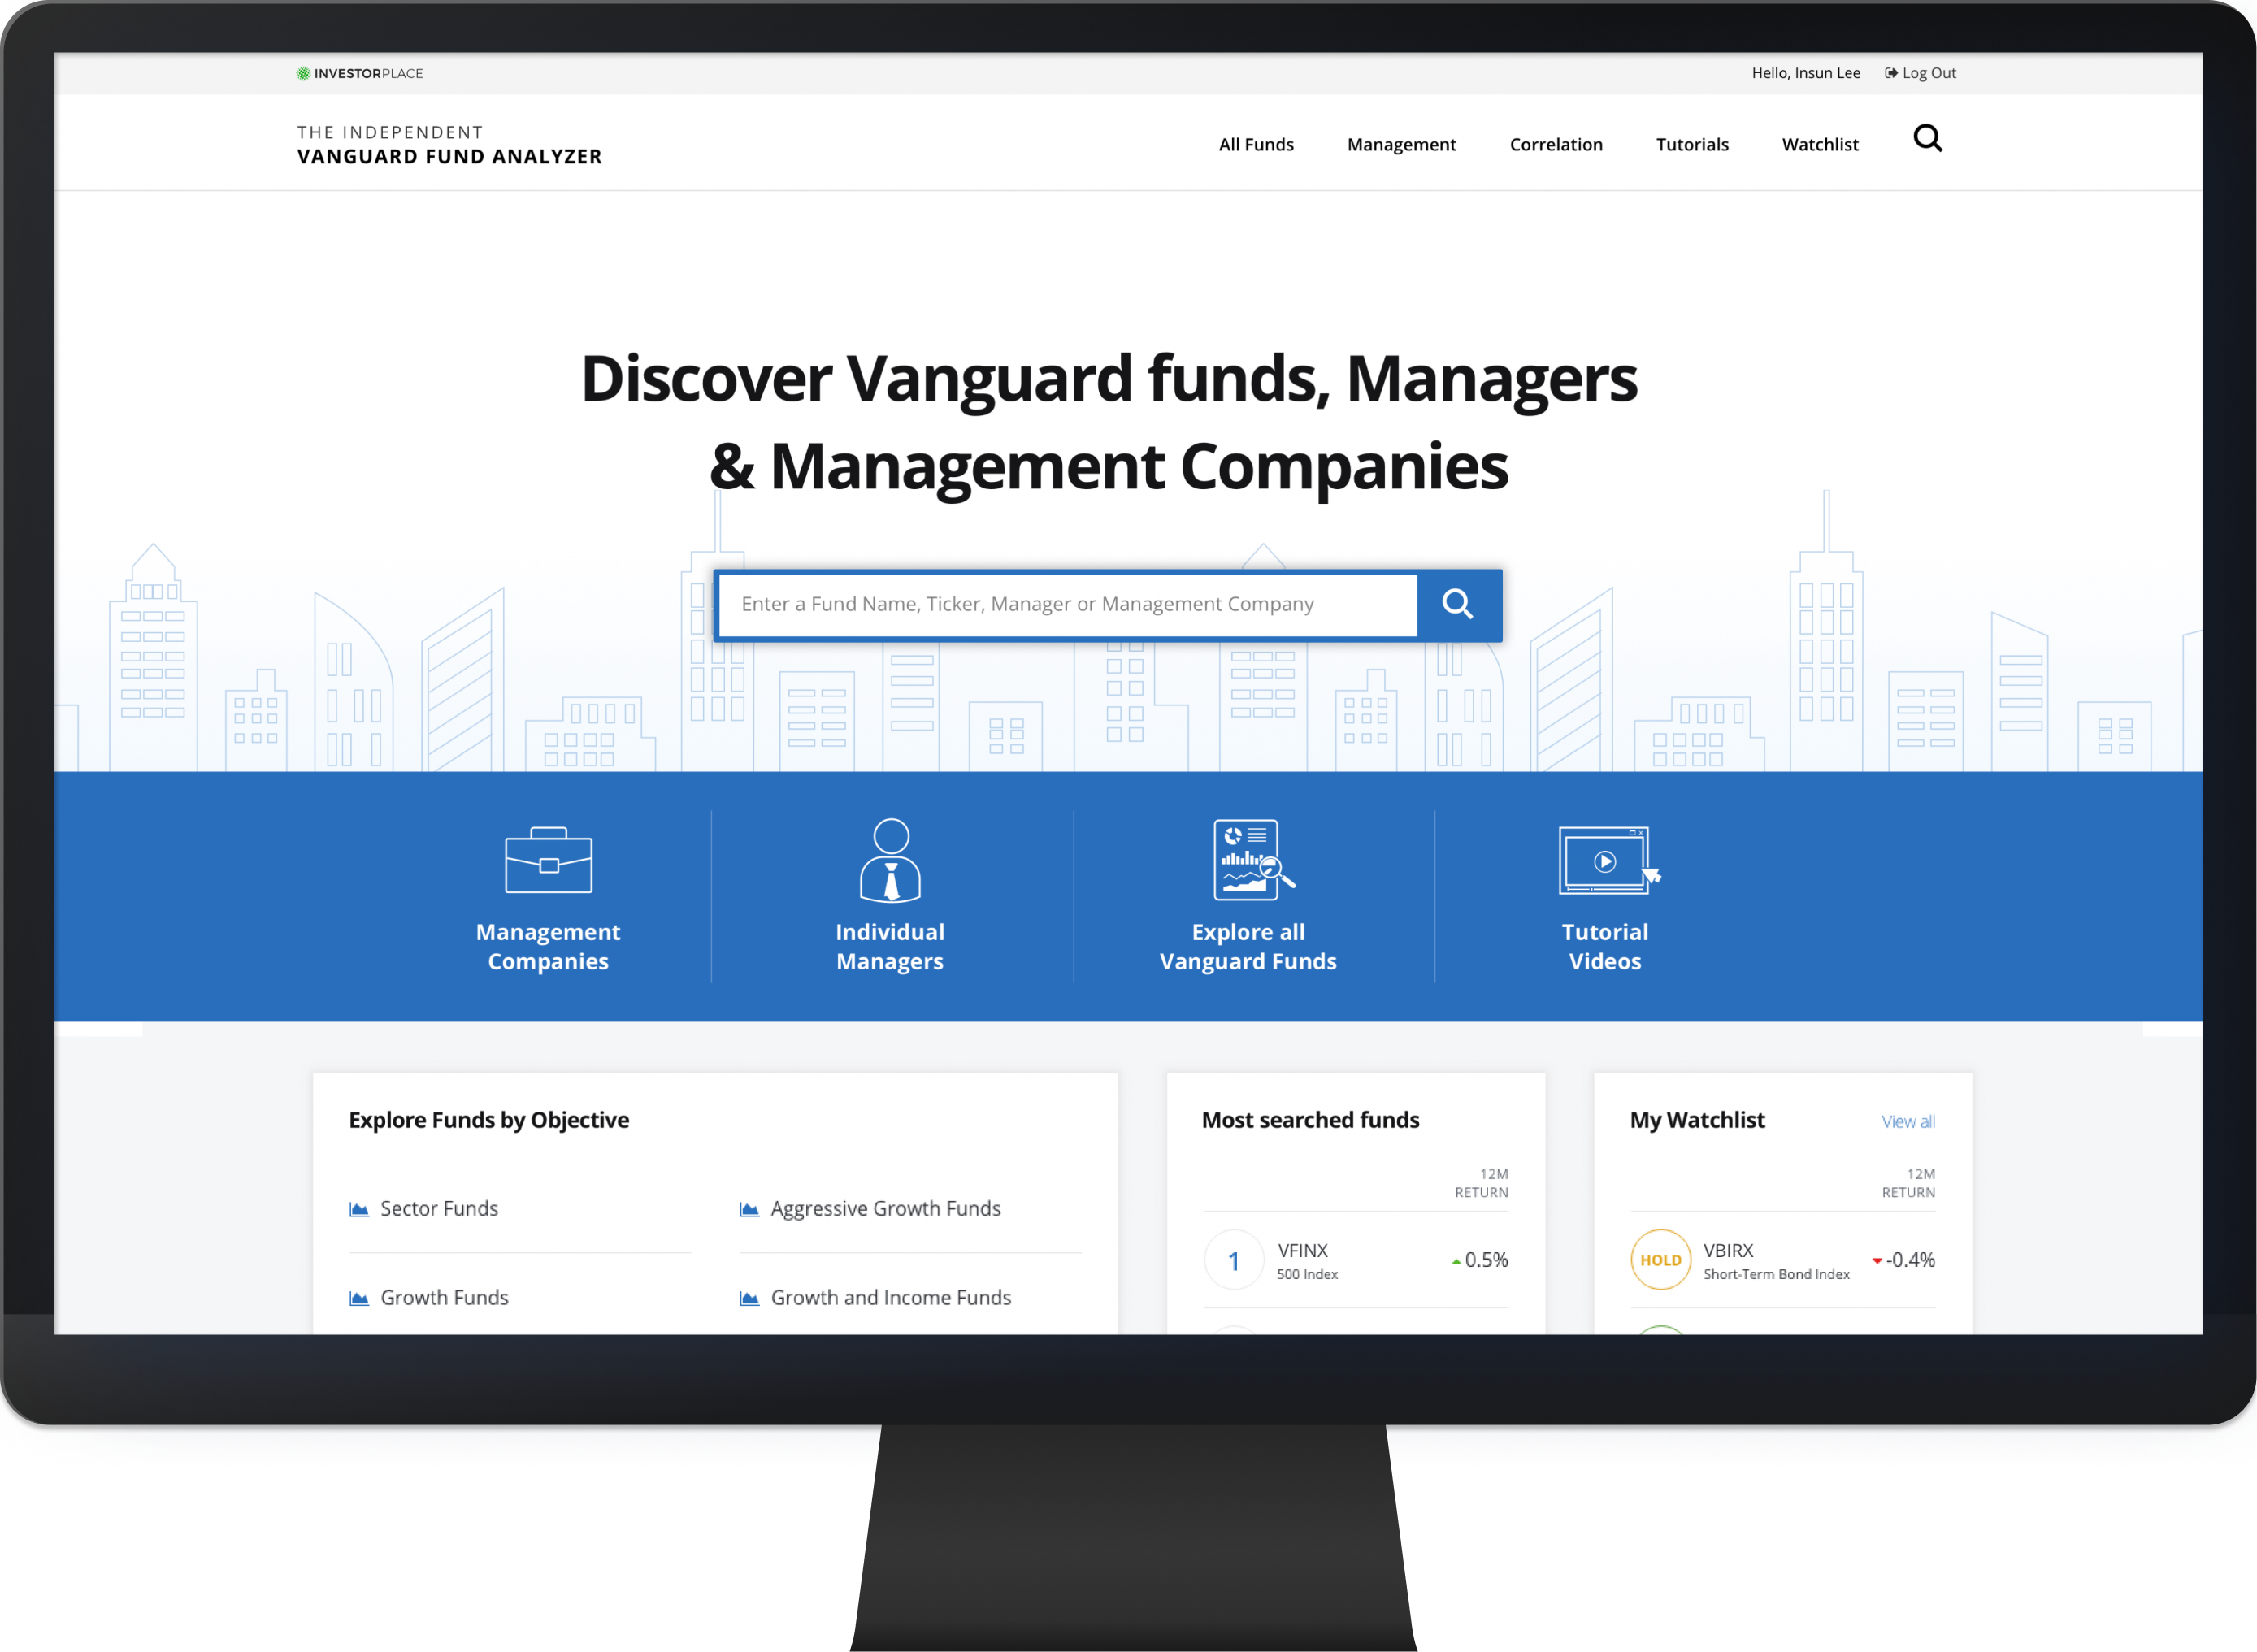
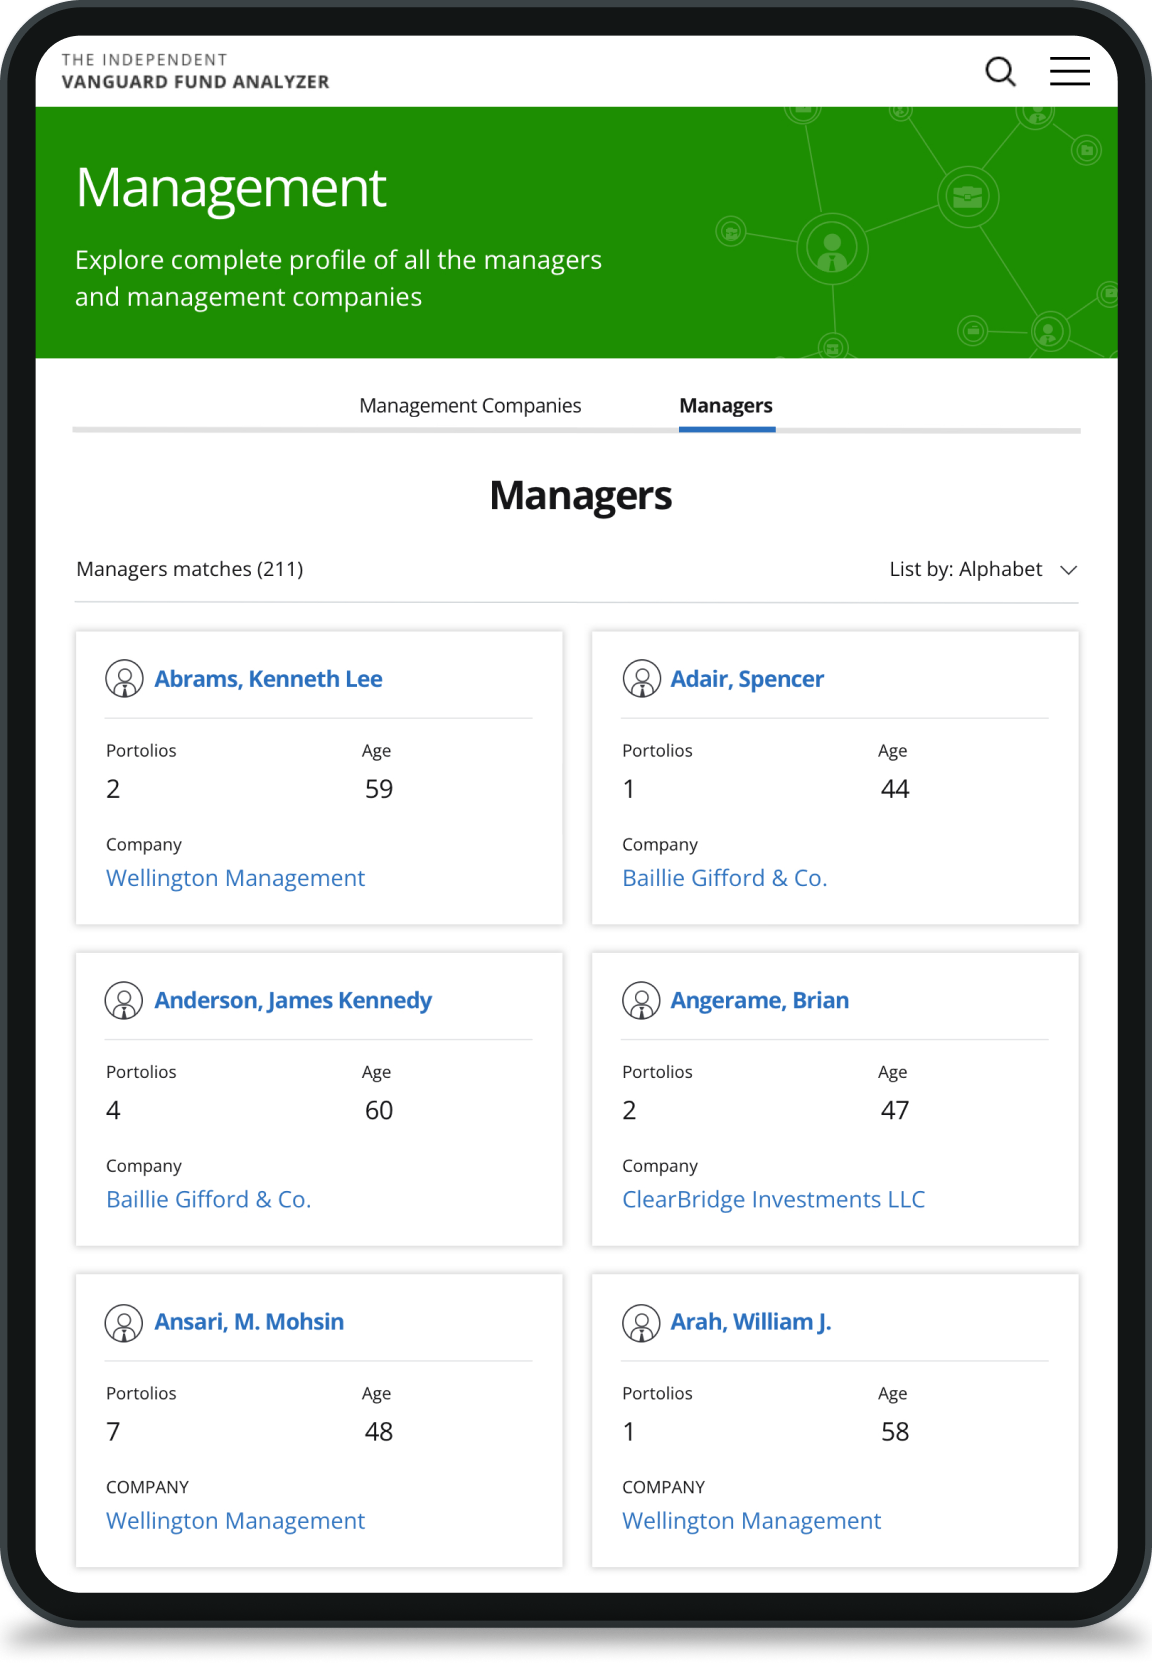
To tackle the challenge of finding specific funds, managers, and companies, we introduced a search function for easy access. The tool prominently displays a large search box, enabling users to swiftly locate desired information. Additionally, our advanced search feature allows users to find specific funds, managers, and companies without navigating through lengthy index pages. This enhancement streamlines the process, saving time and reducing user frustration.
2. Key Solution
Comprehensive Vanguard Fund List with customizable filters
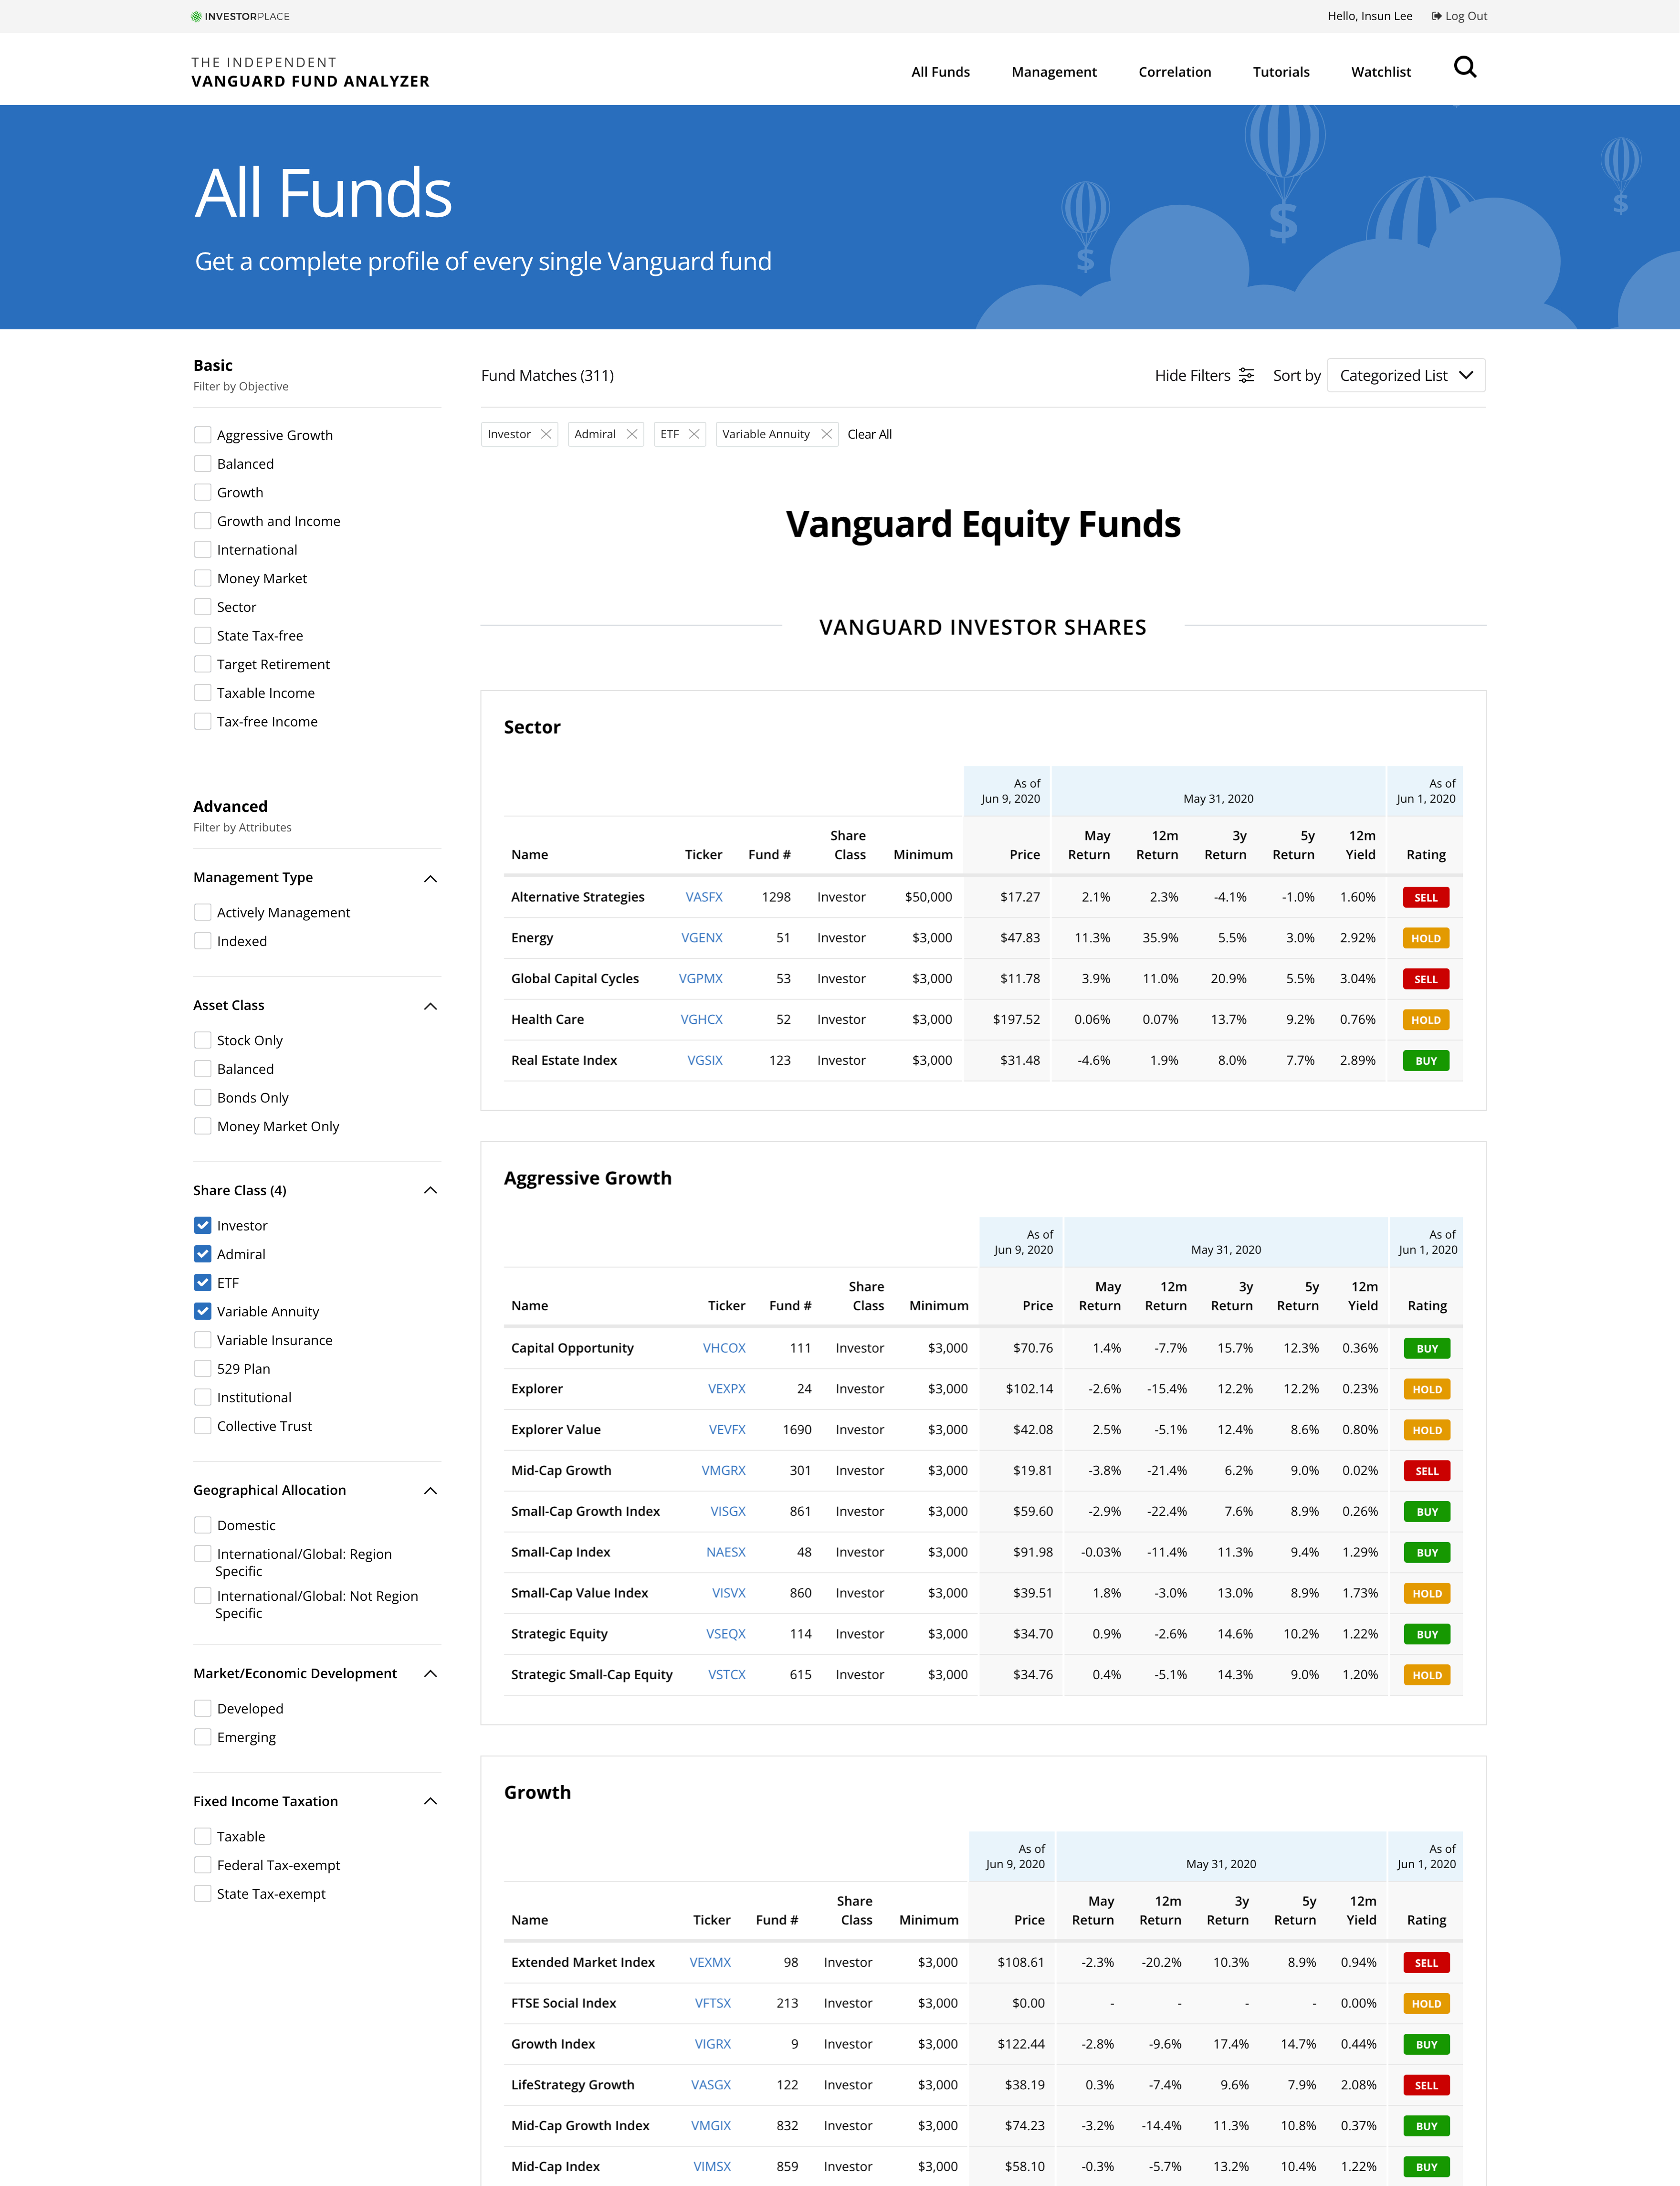
The online tool now offers a comprehensive list of Vanguard funds, replacing the previous index system. Users can customize their search with filters and directly access fund profiles by clicking on tickers.
To ensure effective categorization, I collaborated with content specialists. Additionally, I integrated fund ratings from Dan Wiener, distinguished by distinct colors, enhancing user navigation and highlighting key interests.
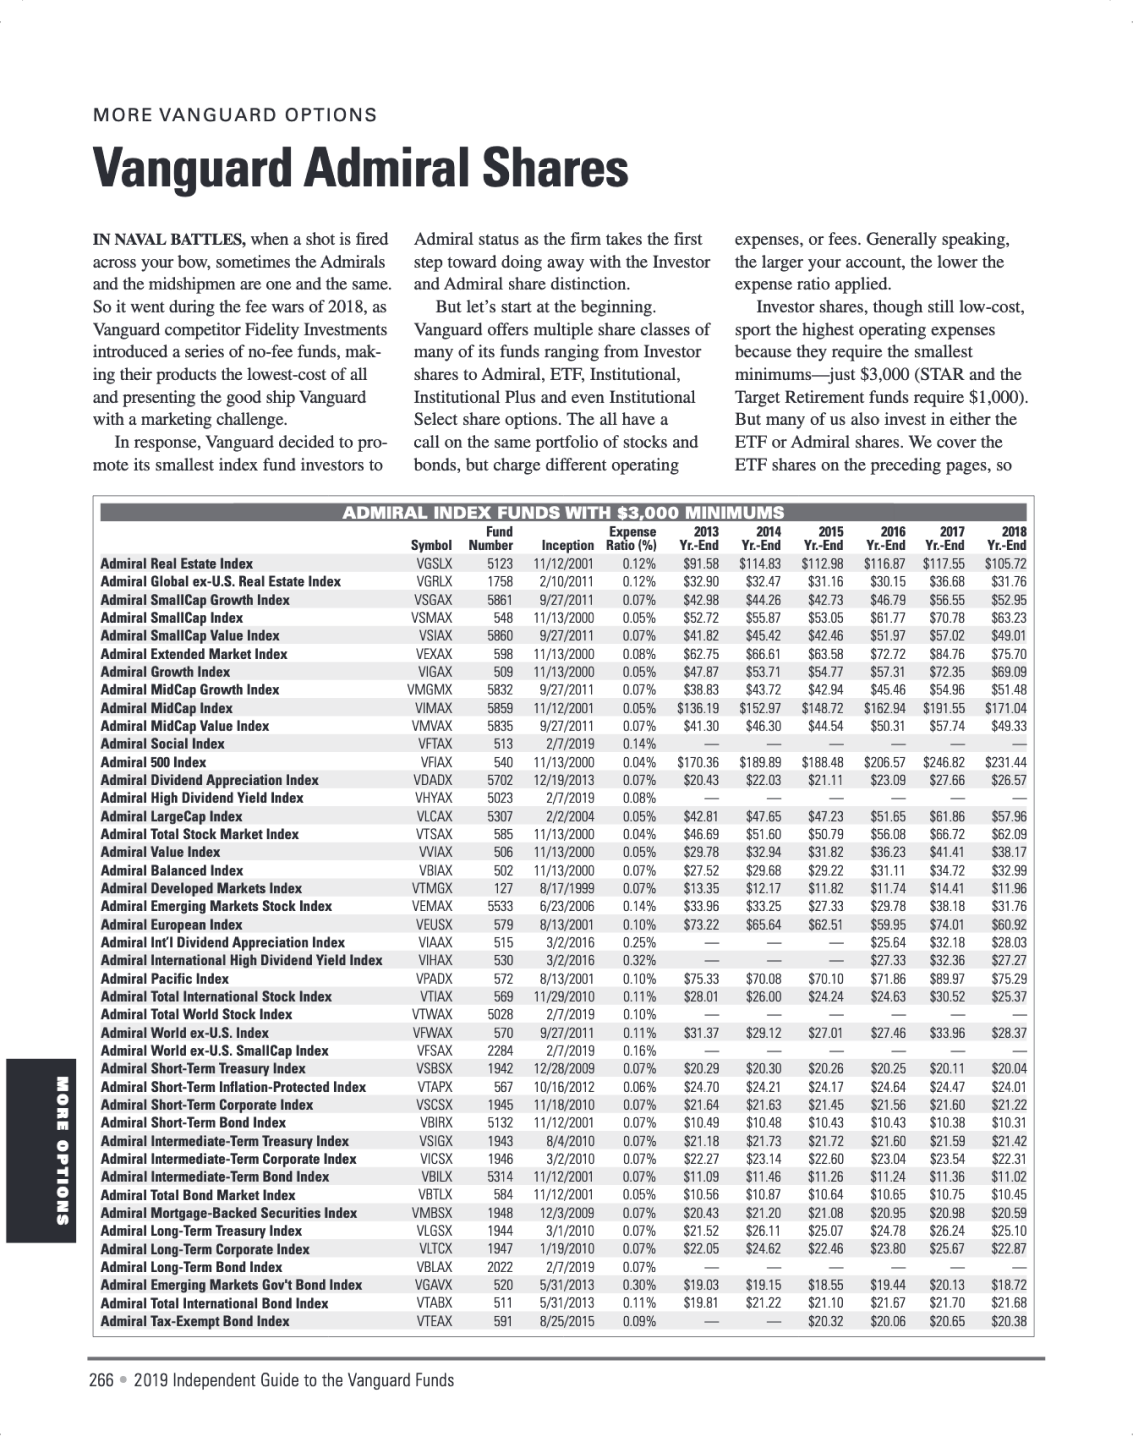
Fund list page in the book
3. Key solution
Clean and minimal interface for enhanced user focus
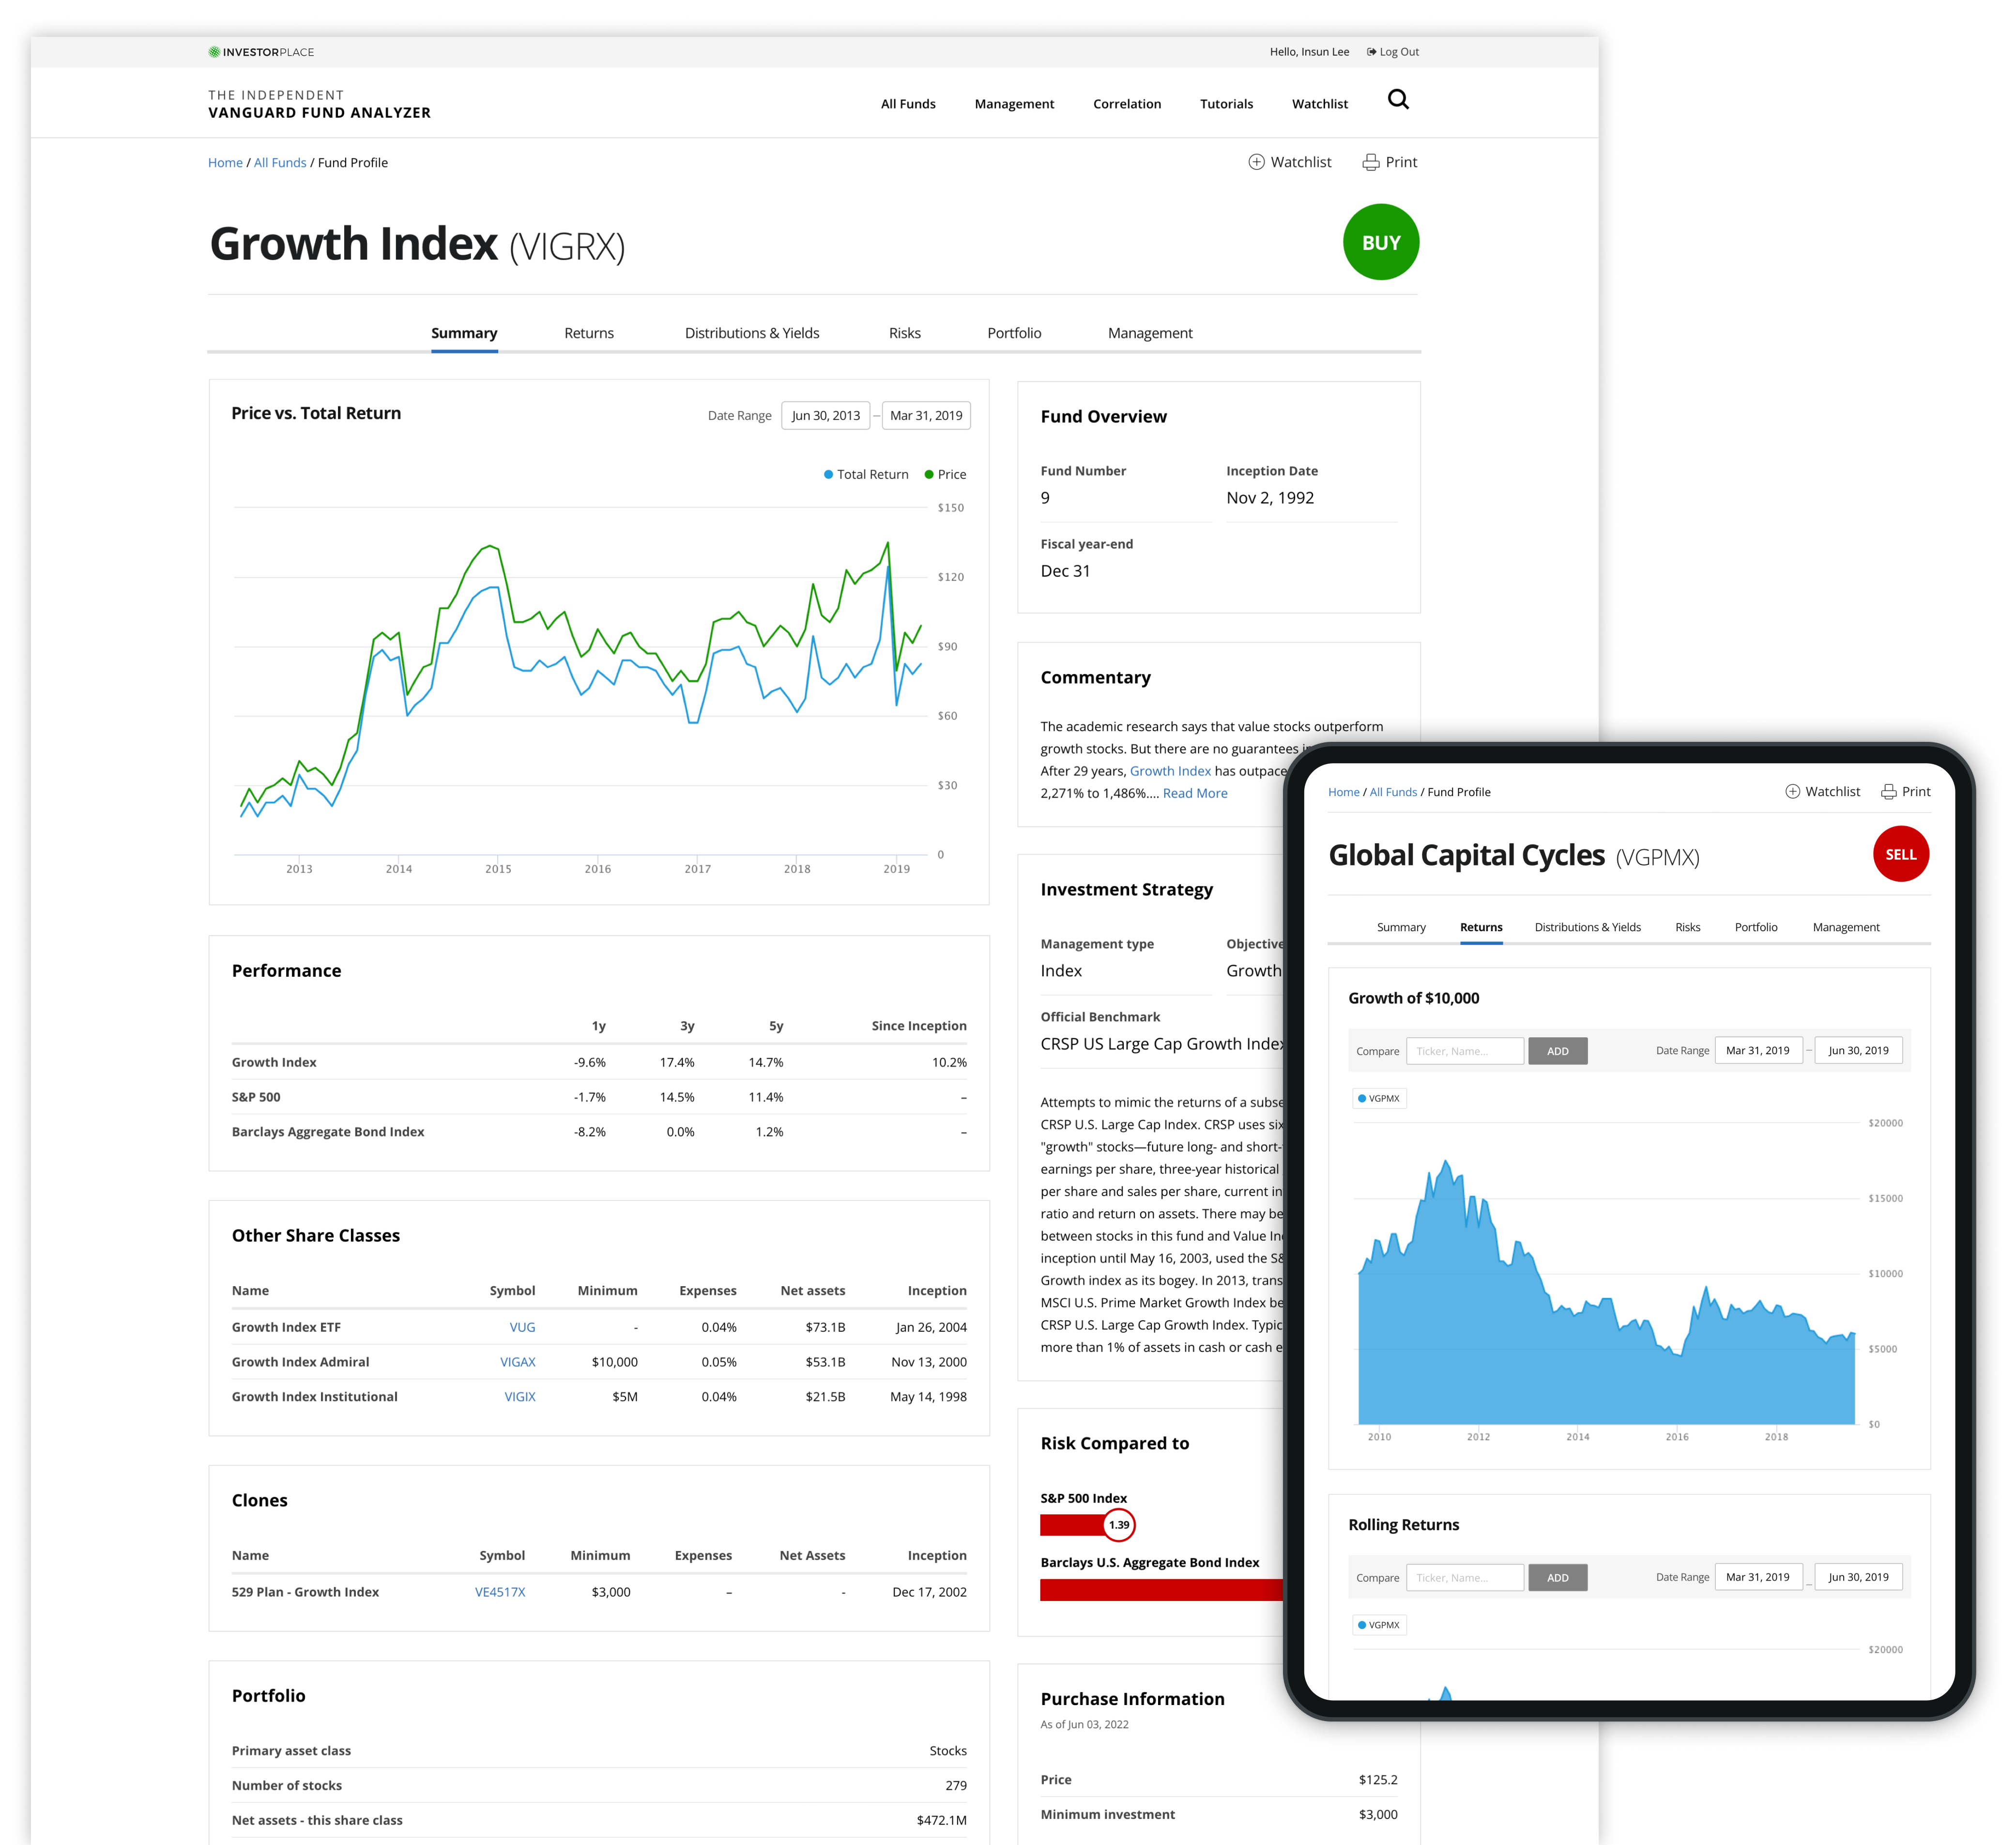
The Fund Analyzer had tons of charts and graphs to show different stats. I opted for a clean, minimal interface to highlight key features and data. Utilizing the basic system font set, I adjusted font weights to enhance screen usability. Additionally, I crafted a distinct color scheme to differentiate data statistics effectively.
Fund Profiles
Retaining and refining essential fund profile components from the book, we organized information more effectively, improving user comprehension. To manage extensive data, we employed tabs for navigation through sub-categories.
The design prioritizes cleanliness and structure, utilizing card blocks to organize content and prevent visual overload. Careful use of white space, contrasting colors, and type scales established a clear visual hierarchy, enabling users to grasp information quickly.
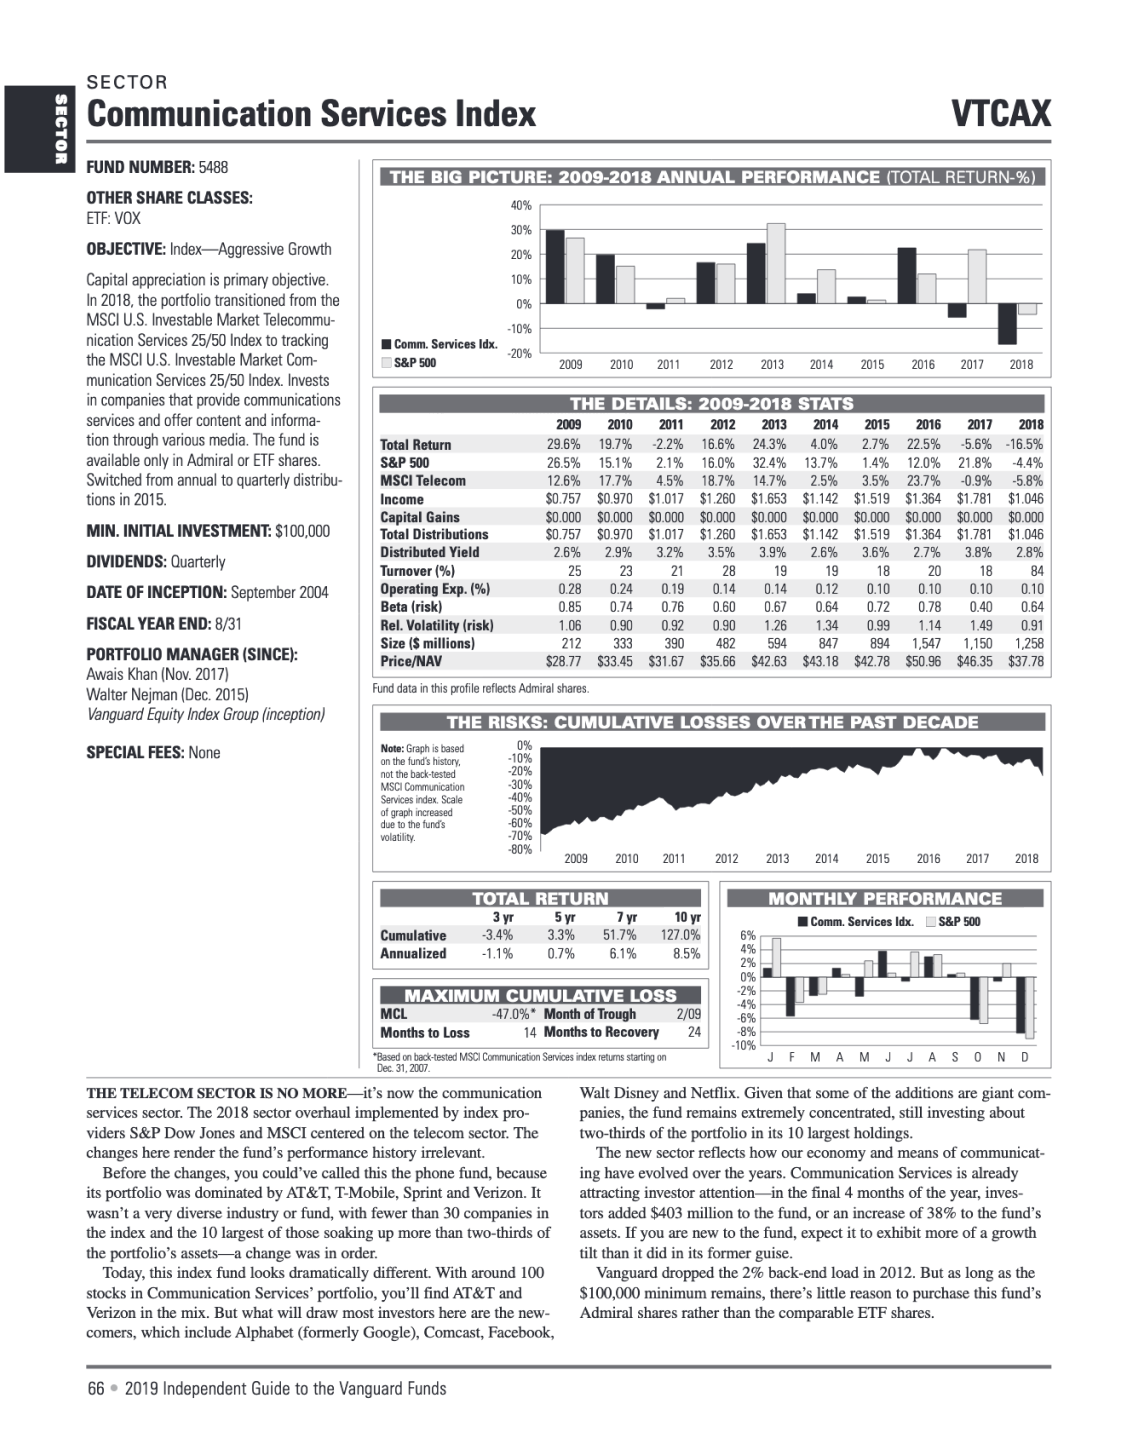
Fund profile page in the book
4. key solution
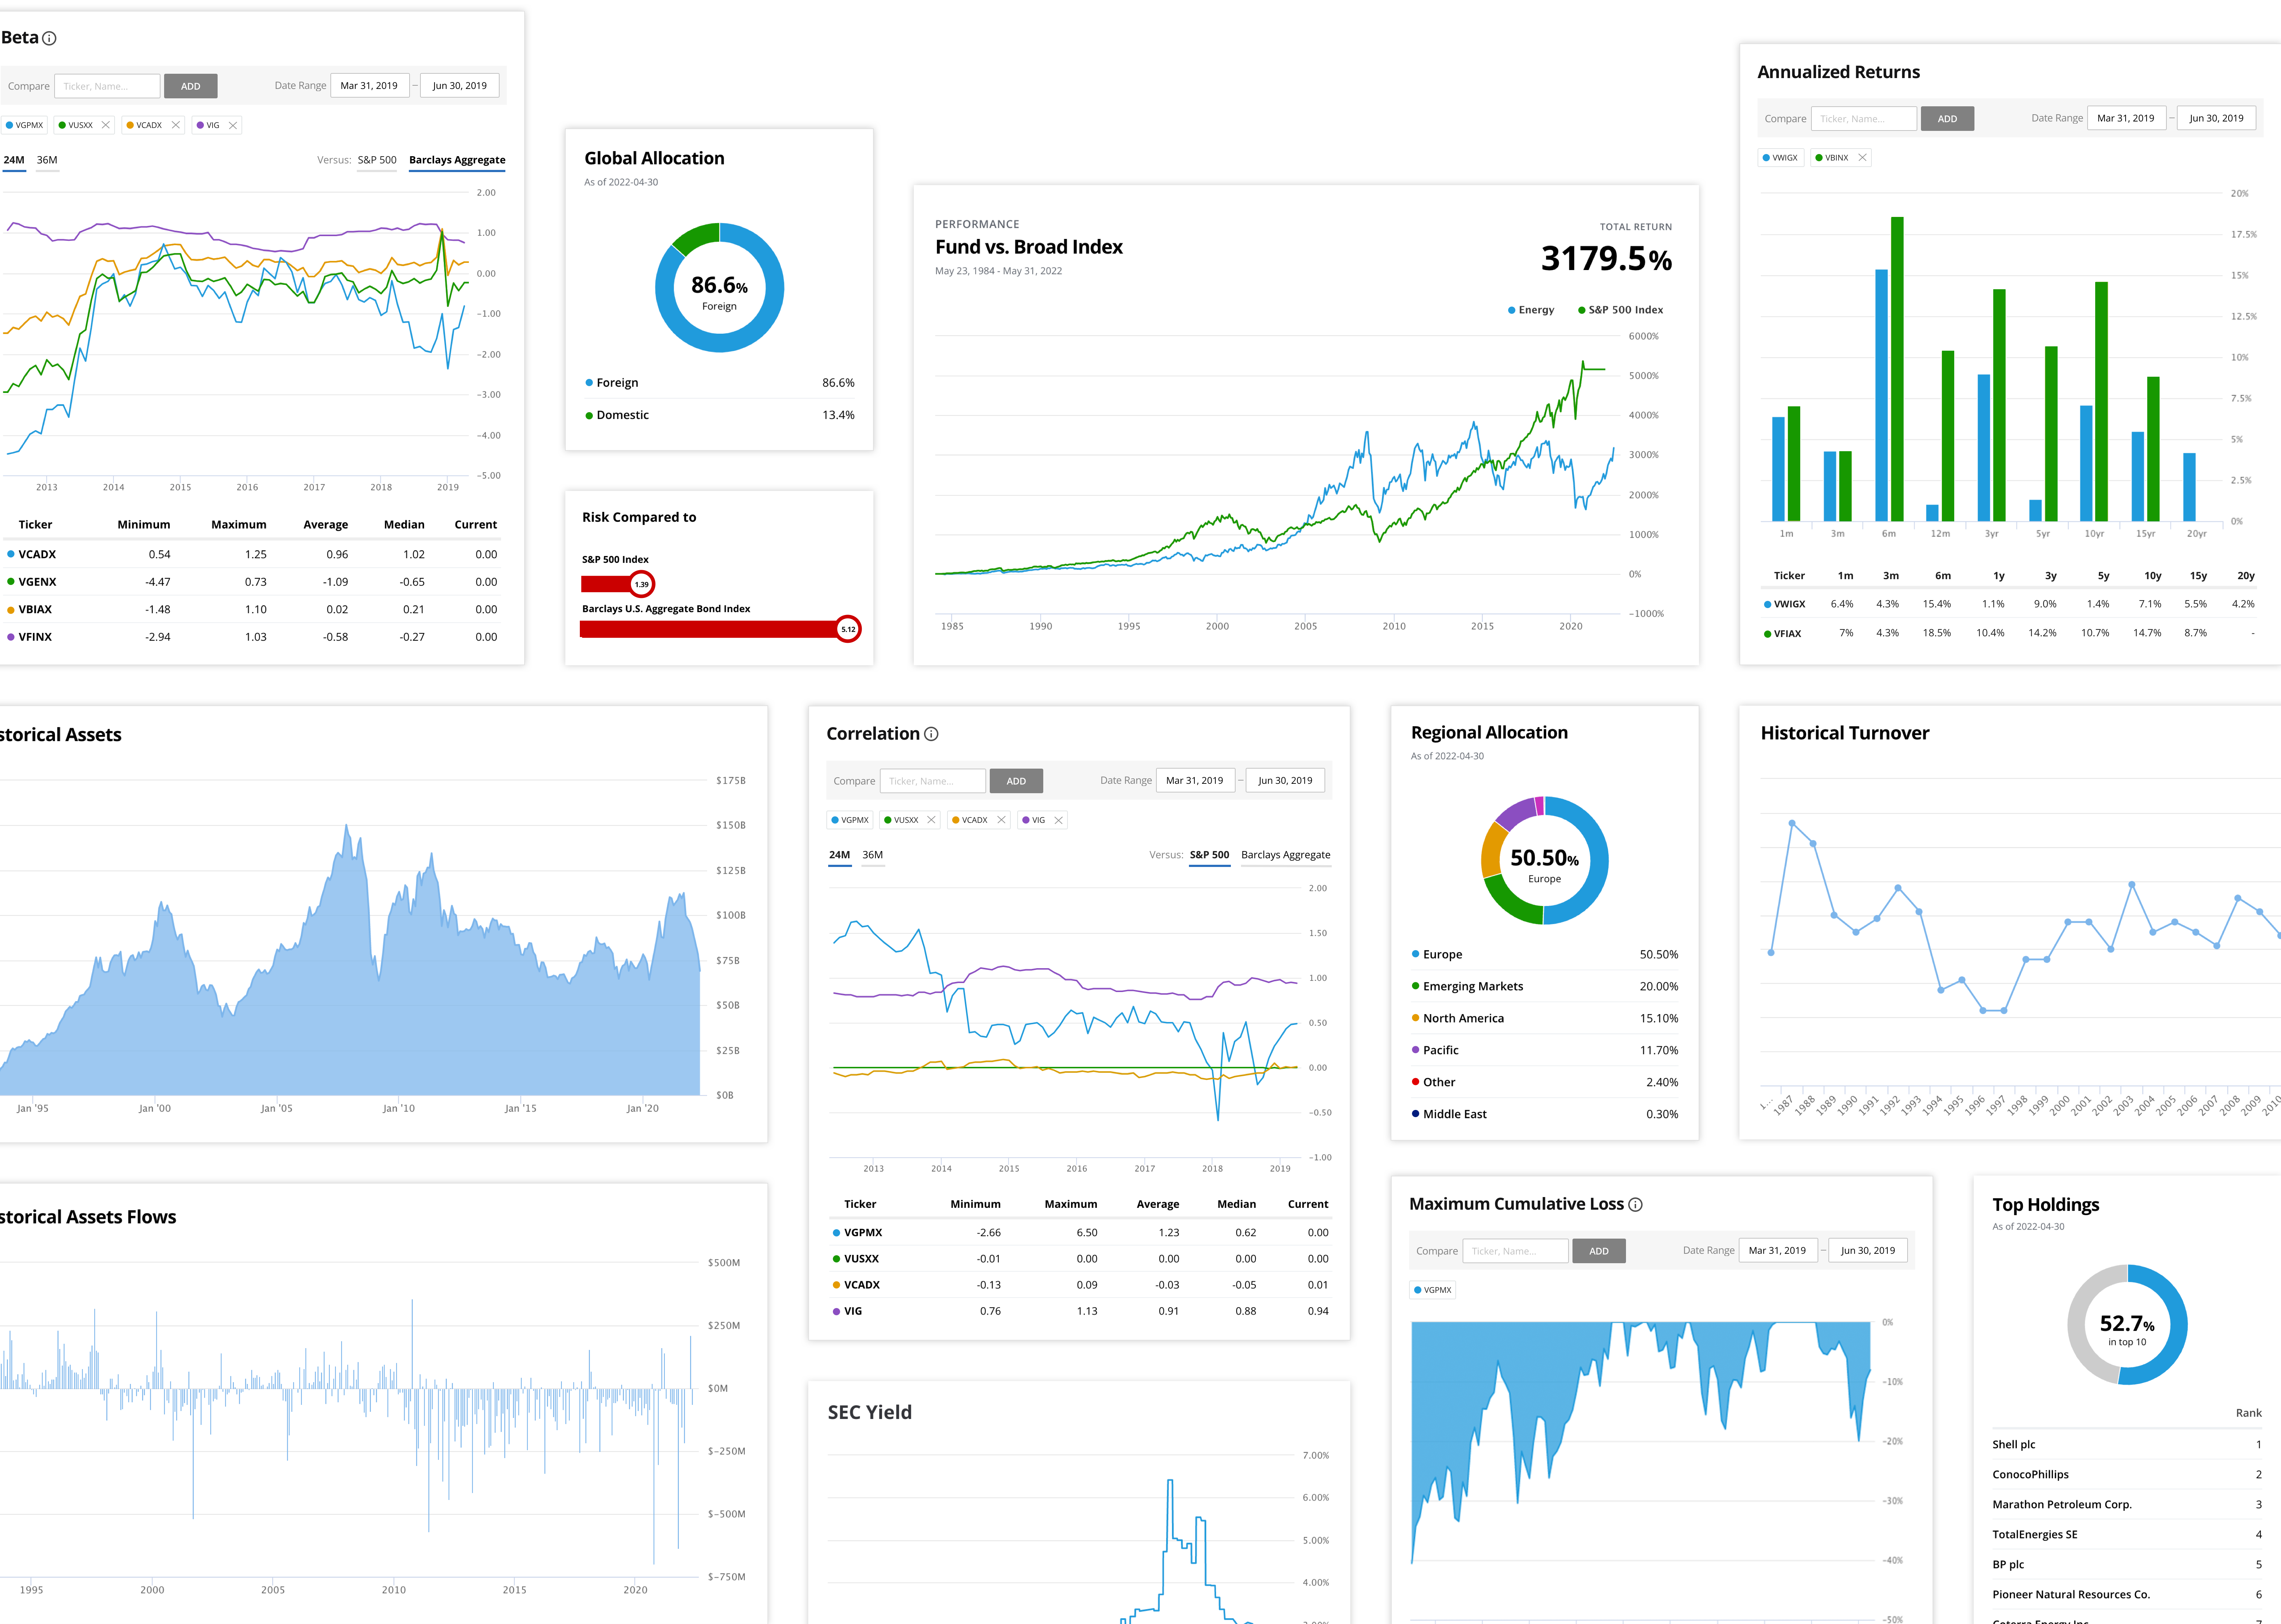
Dynamic and Interactive Data
Addressing the challenge of visualizing charts and graphs effectively, I collaborated with content editors and developers to select suitable chart types. While retaining most chart types from the book, we enhanced the UI design and introduced new methods for certain data sets. For instance, plain text data in the global allocation chart was replaced with a donut chart for improved comprehension.
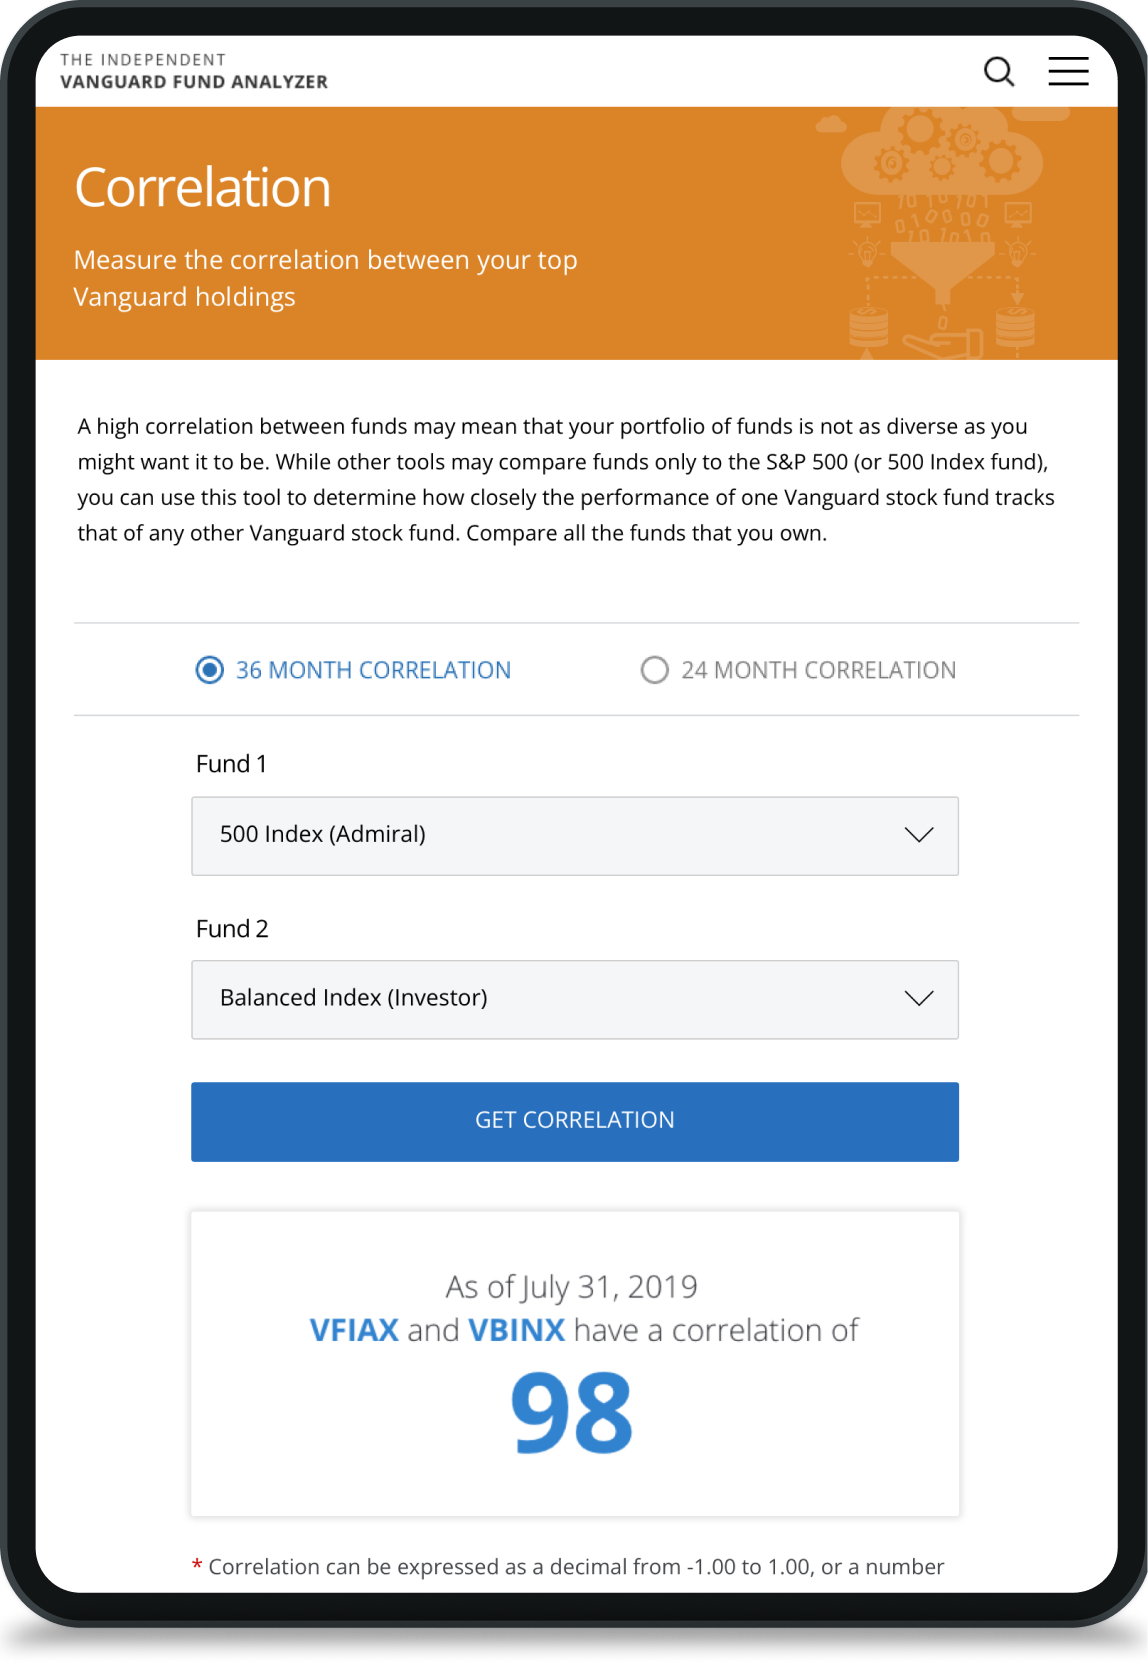
Previously, guidebook readers navigated complex grids line by line for information. Our tool now allows users to visualize fund data effortlessly, customize data coverage, and conduct cross-comparison analyses across various funds.
©2024 Insun Lee All rights reserved.