Portfolio Grader 500
Incredibly powerful stock analysis tool for individual investors
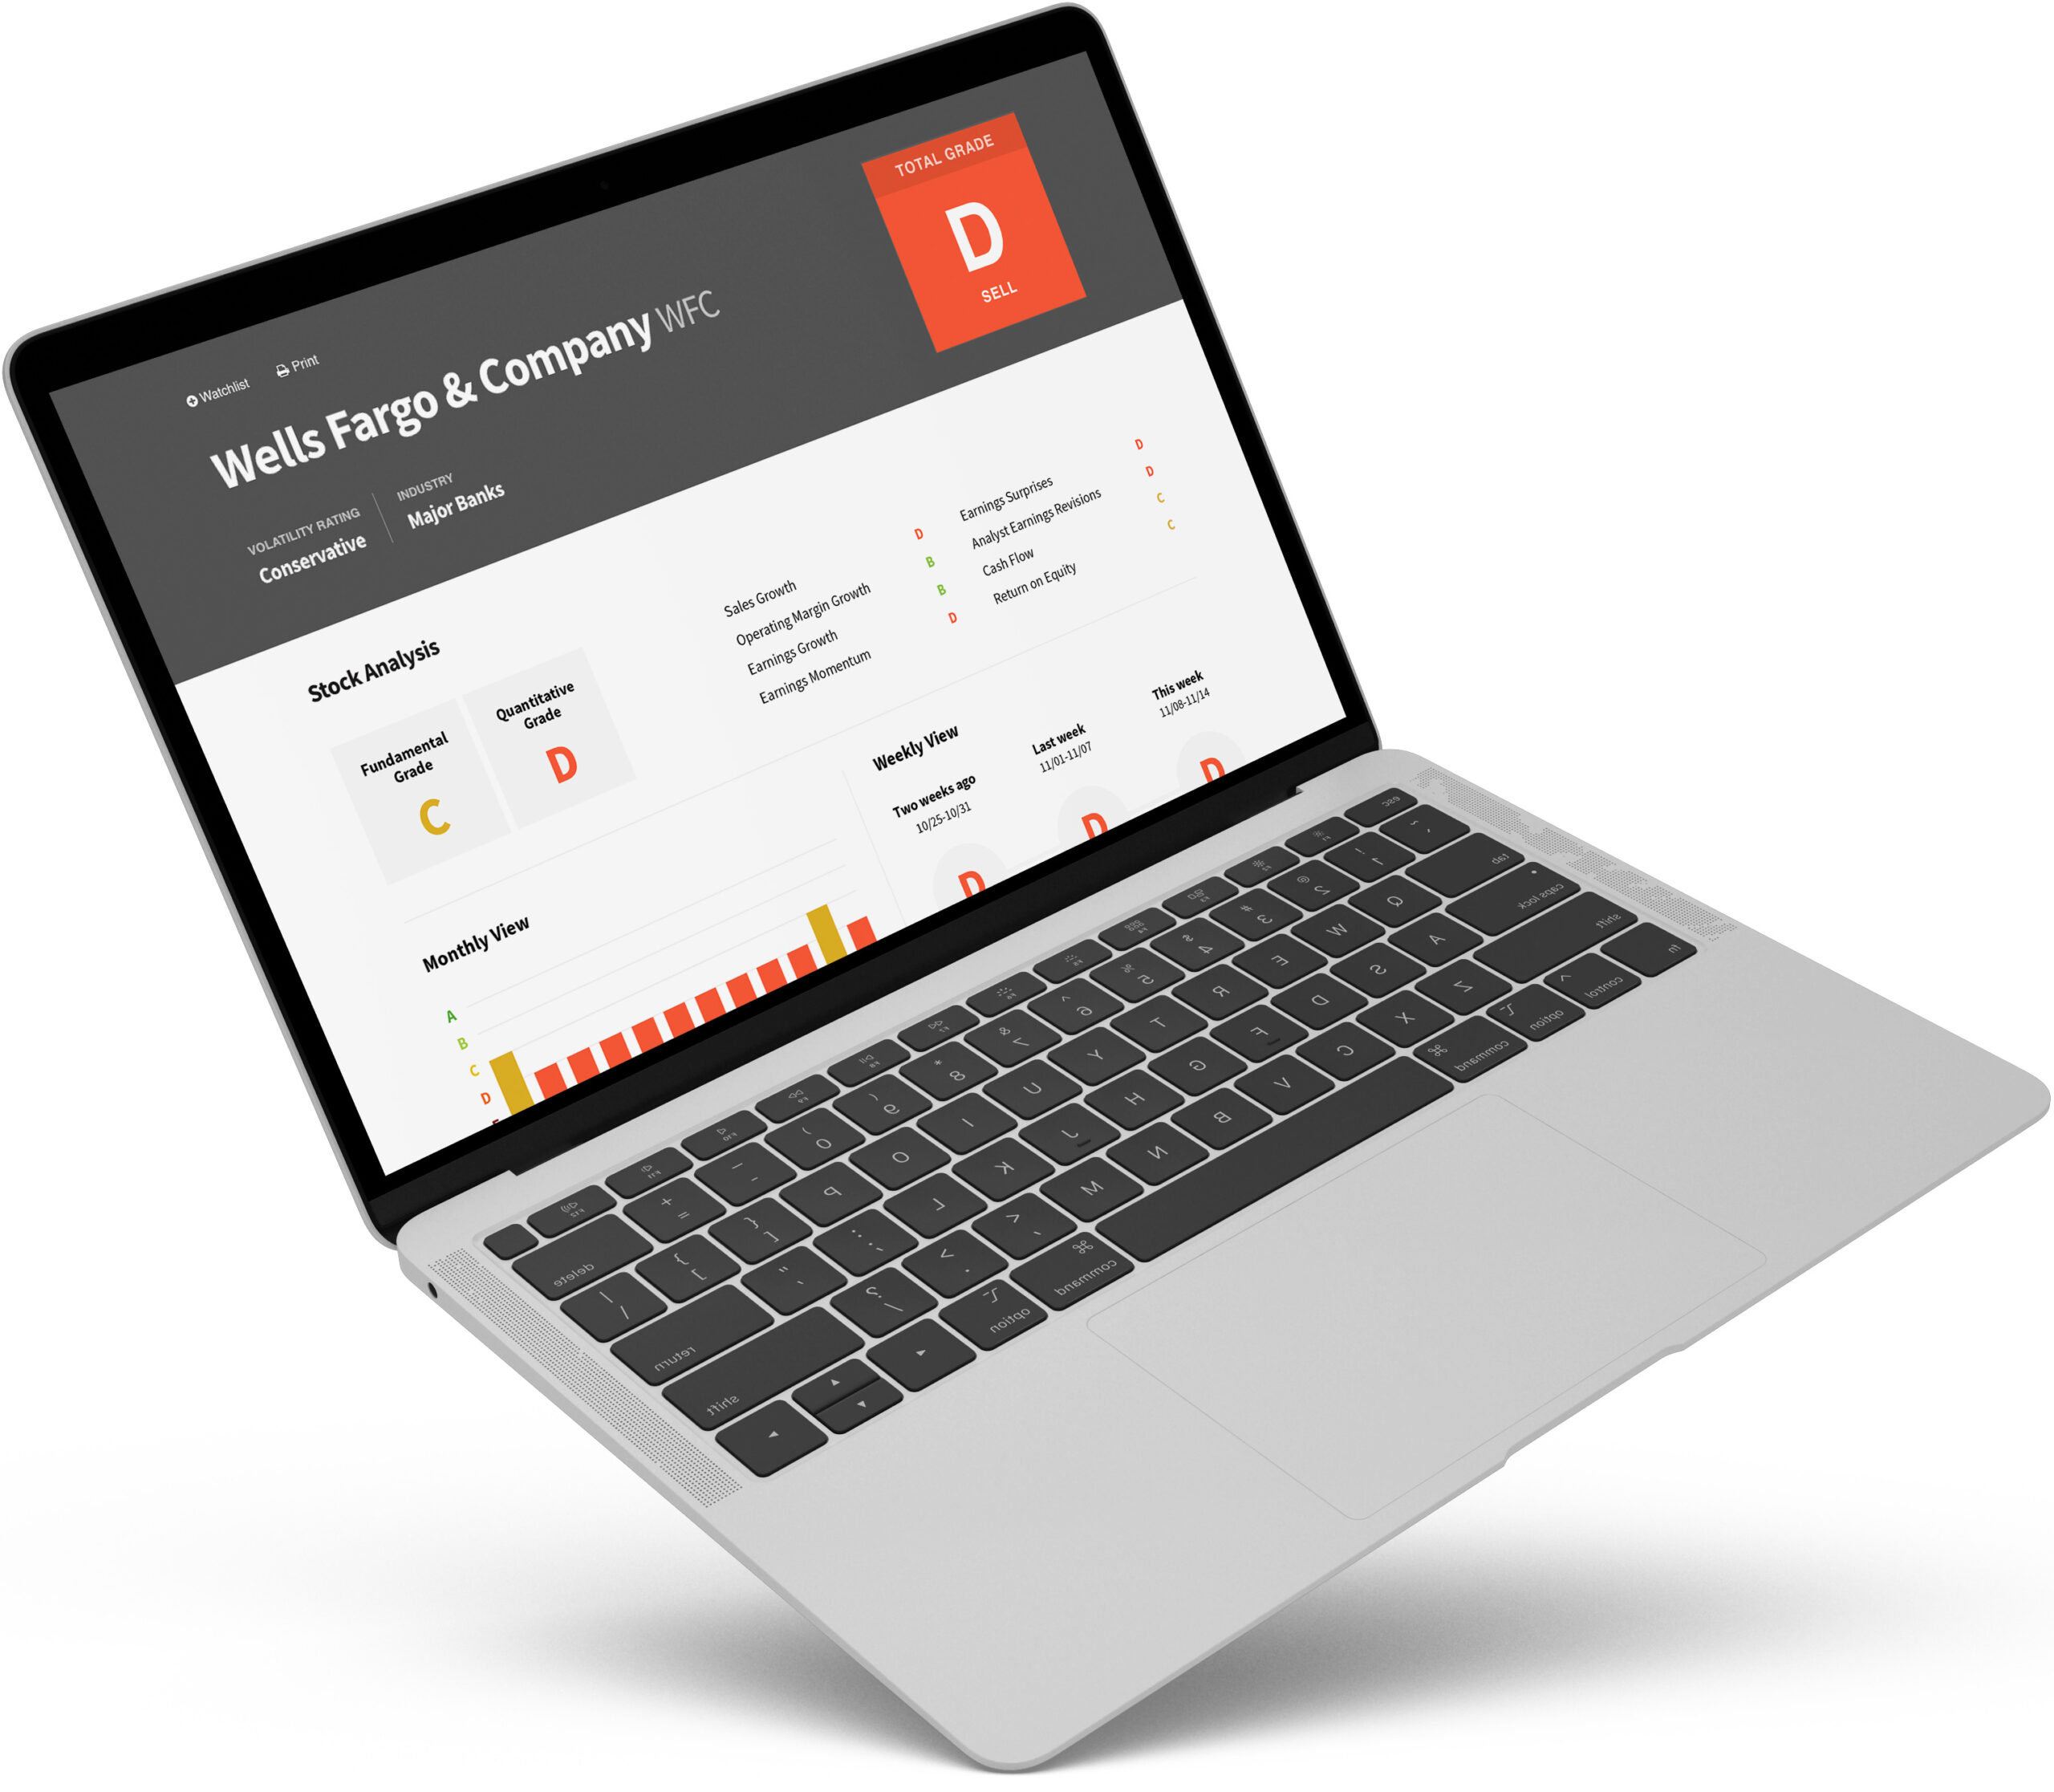
The Portfolio Grader 500 is a powerful stock analysis tool curated by renowned growth investor Louis Navellier. Initially available in static PDF format, it features the top 250 and bottom 250 stocks in the market. As the demand surged for an online version, I led the website design project to convert the PDF into an interactive website.

The PDF version of Portfolio Grader 500
Key Problems
Lack of Overview
In the PDF version, users couldn't check the entire stock list at once.
Static Data
Users couldn't access real-time stock data due to quarterly updates.
Distraction in UI Design
Excessive colors and component hierarchy issues hindered content focus.
Key Solutions
Comprehensive Stock List
Introduce a master list of all Portfolio Grader 500 stocks for quick overview.
Dynamic Data
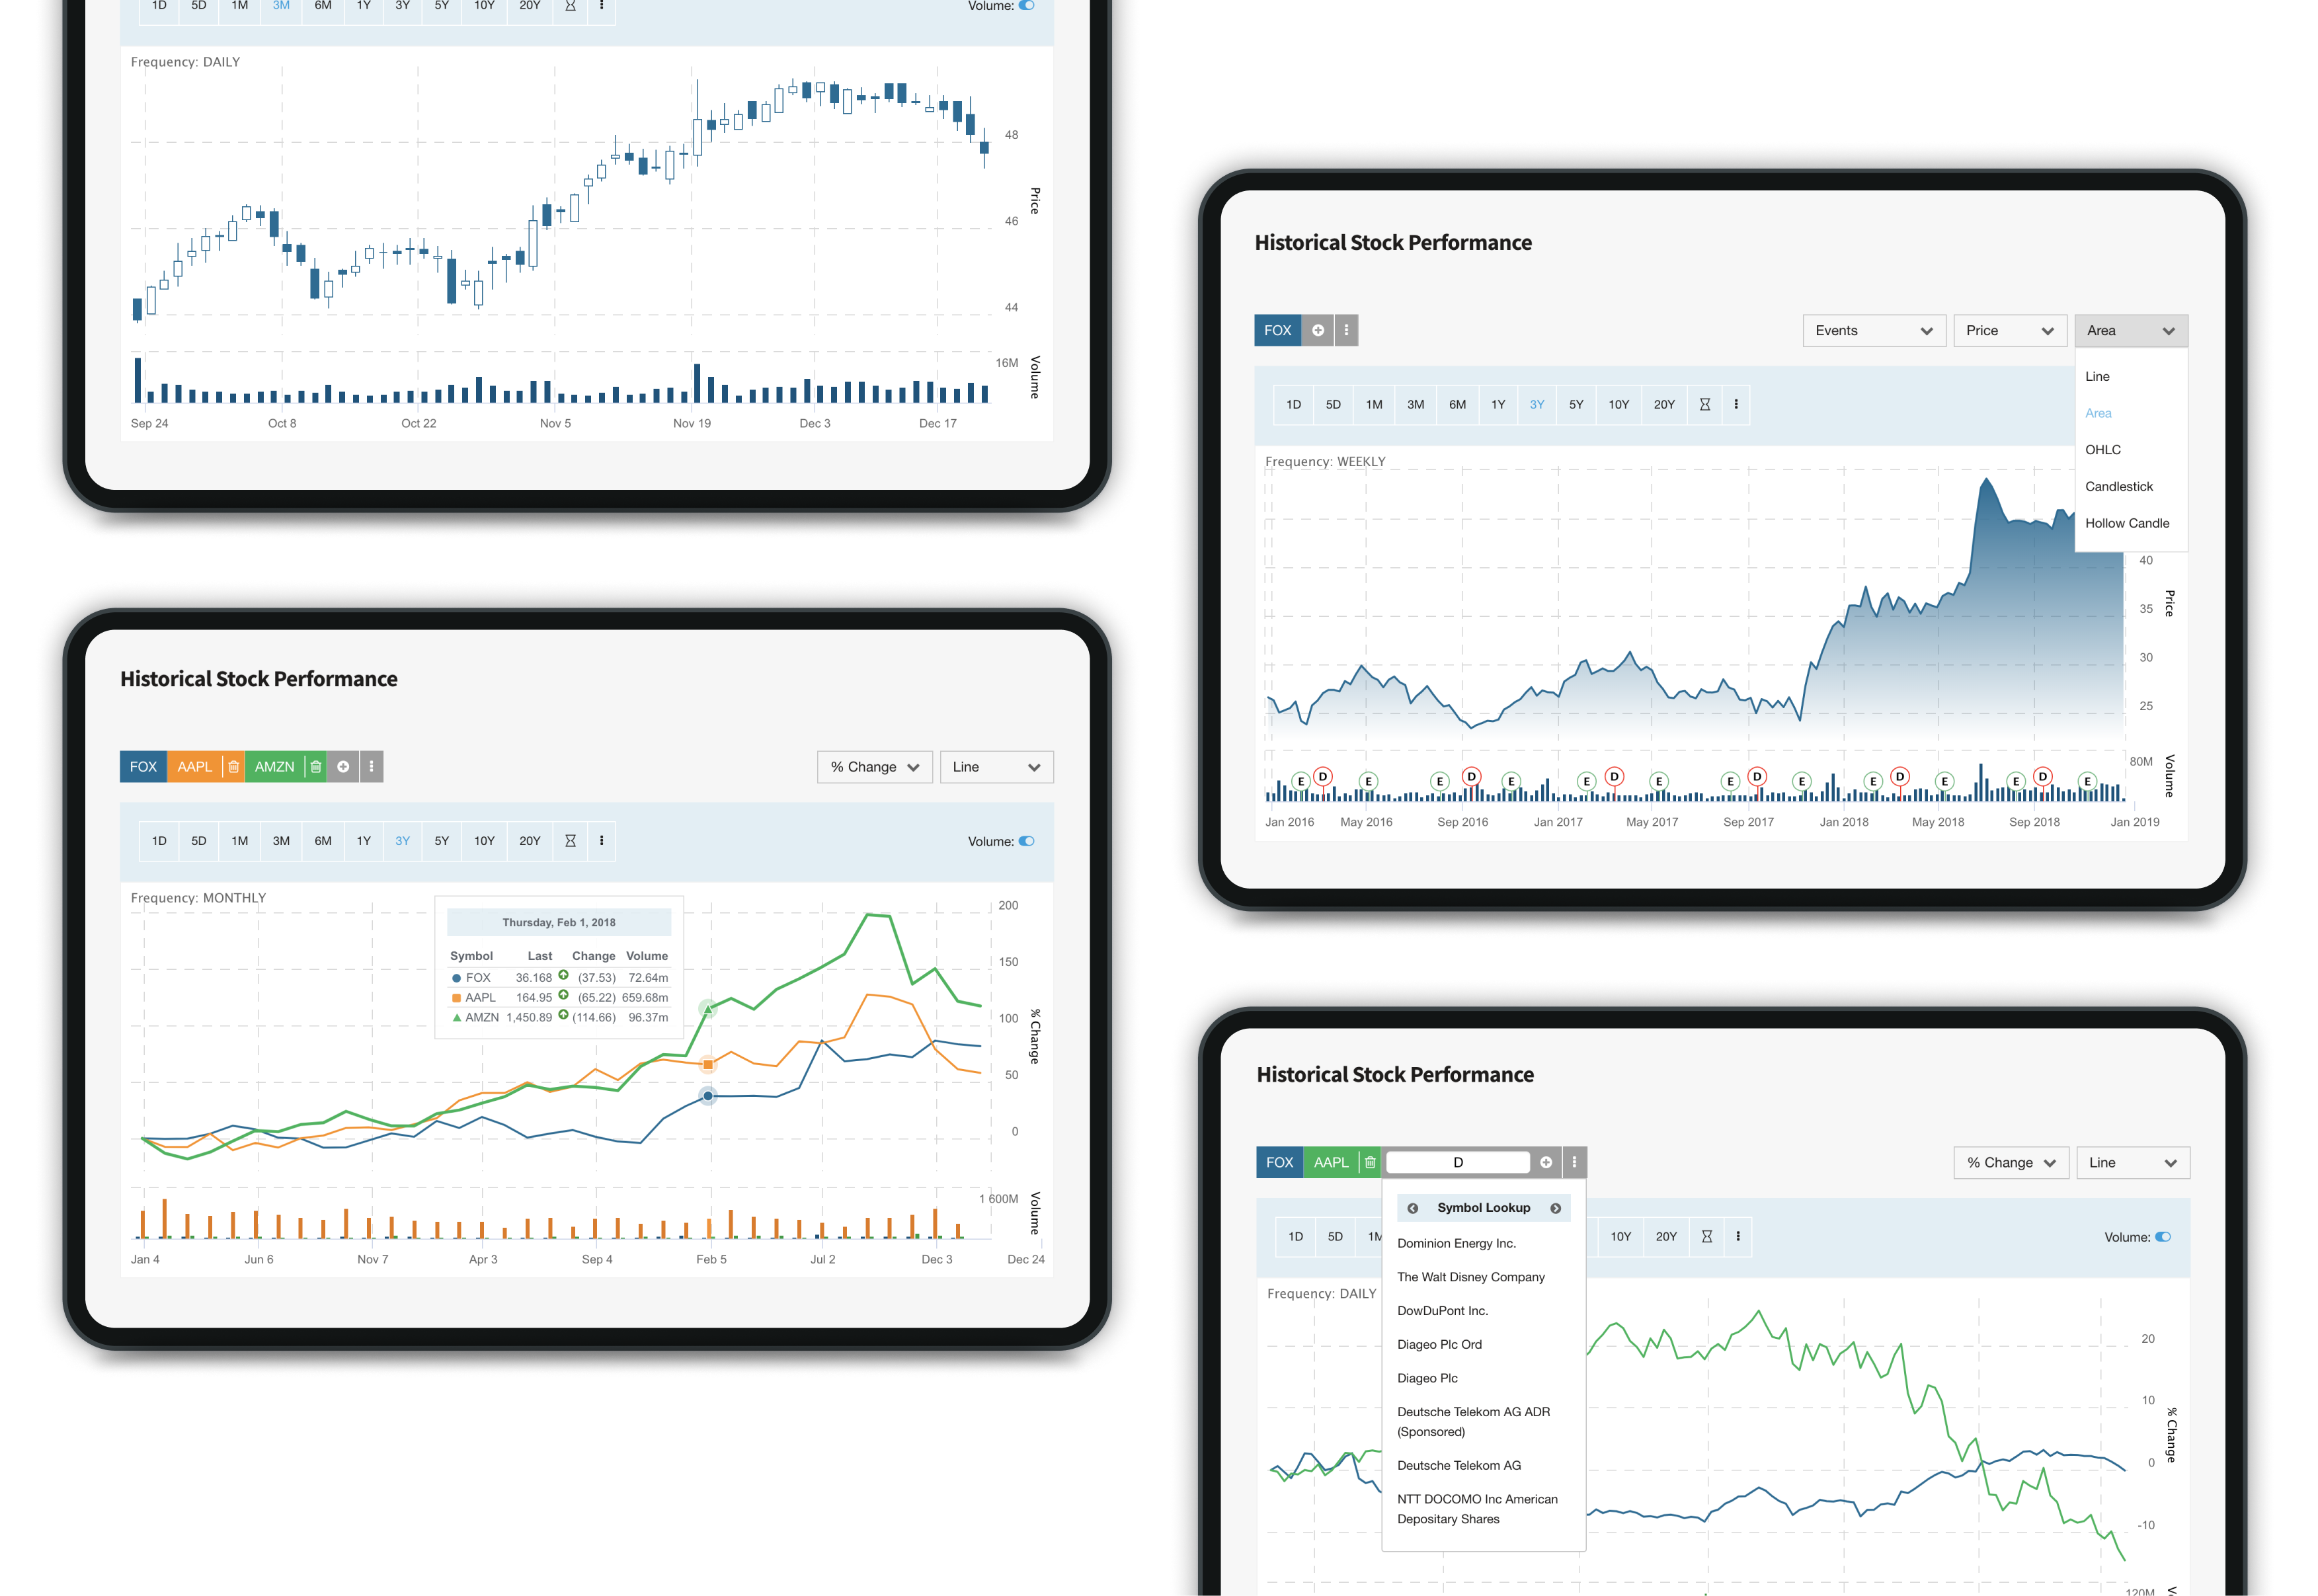
Introduce interactive charts for real-time stock performance data, enhancing user engagement and insight.
Enhanced Search Functionality
Implement a versatile search feature allowing users to find specific stocks easily.
My Role
I was the only designer on the team. As a lead designer, I've worked with marketing editors and web developers to create new designs for both mobile and desktop.
Responsibilities
Responsibilities
Responsibilities
Responsibilities
Responsibilities
Creative & Art Direction
User Experience Design
User Interface Design
Visual Design
Prototyping
Final design
Easy and Simple
In contrast to the PDF report, the Portfolio Grader 500 website offers a comprehensive list of all 500 stocks. Users can effortlessly access individual stock details by clicking on any stock name or ticker from the lists. Additionally, a search bar has been integrated into the homepage, enabling users to search for specific ticker symbols, company names, or sectors/industries. Our goal is to streamline the stock-finding process, making it intuitive and efficient for users.
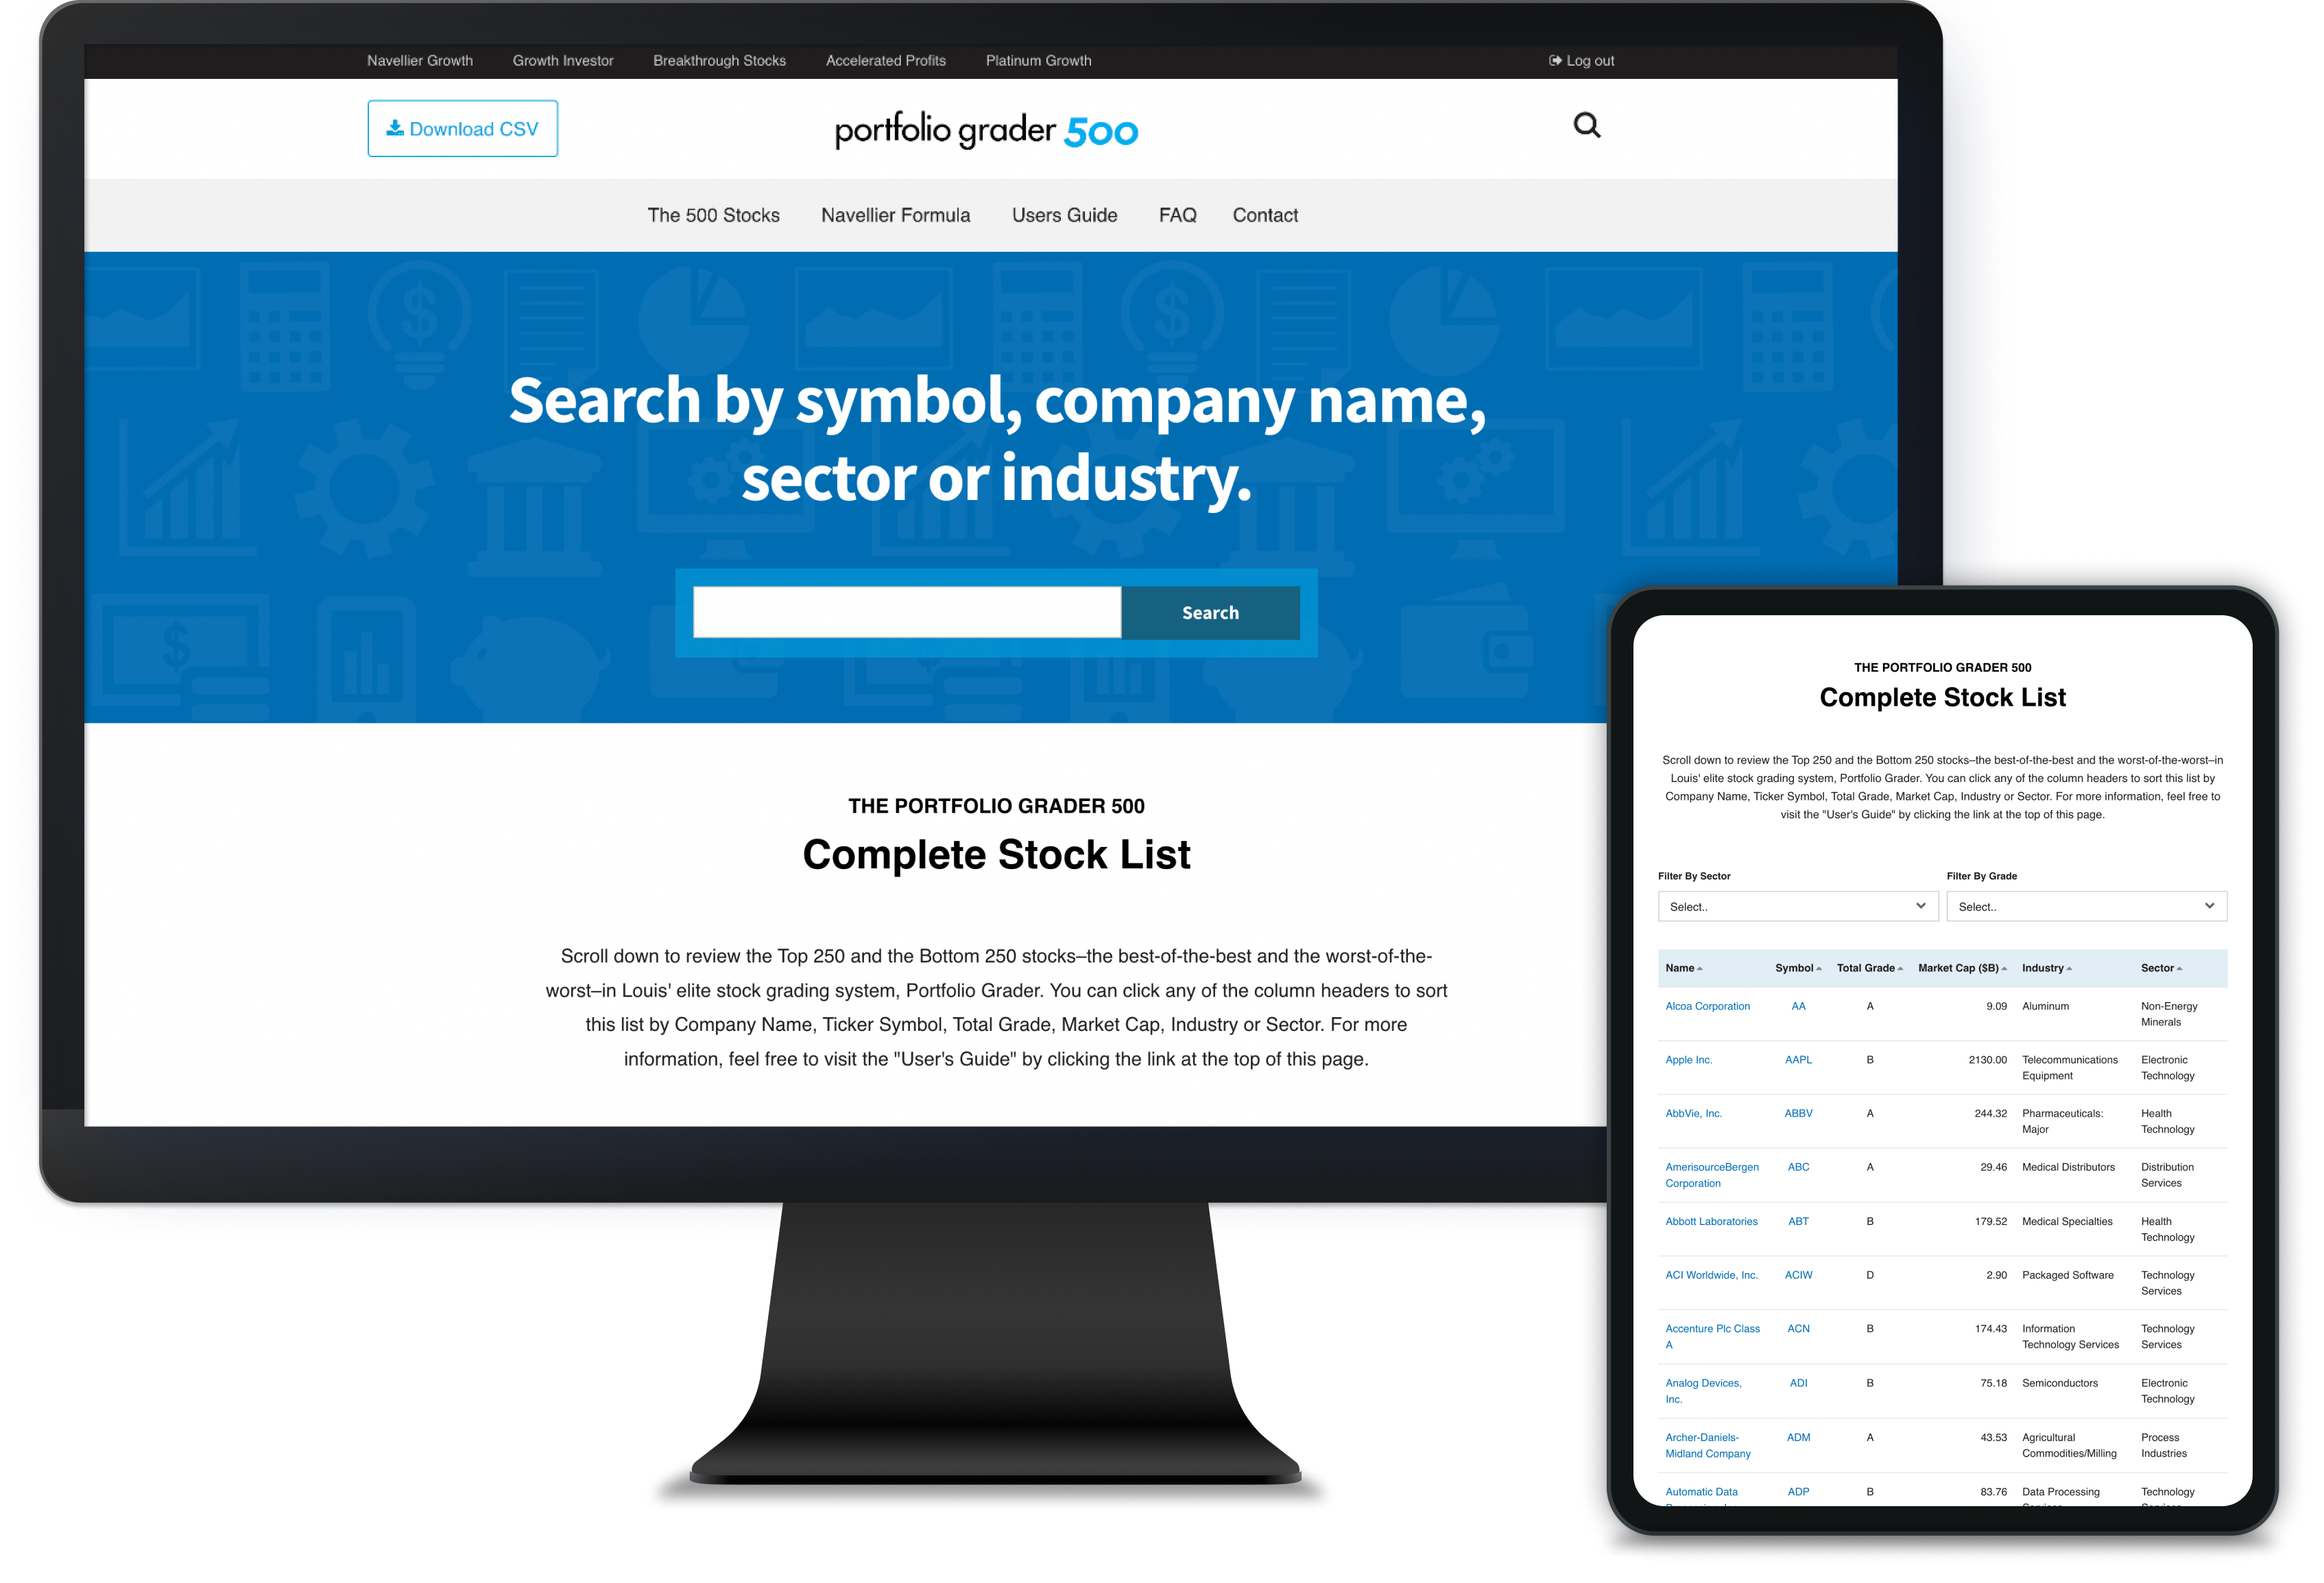
Final design
Stock Reports
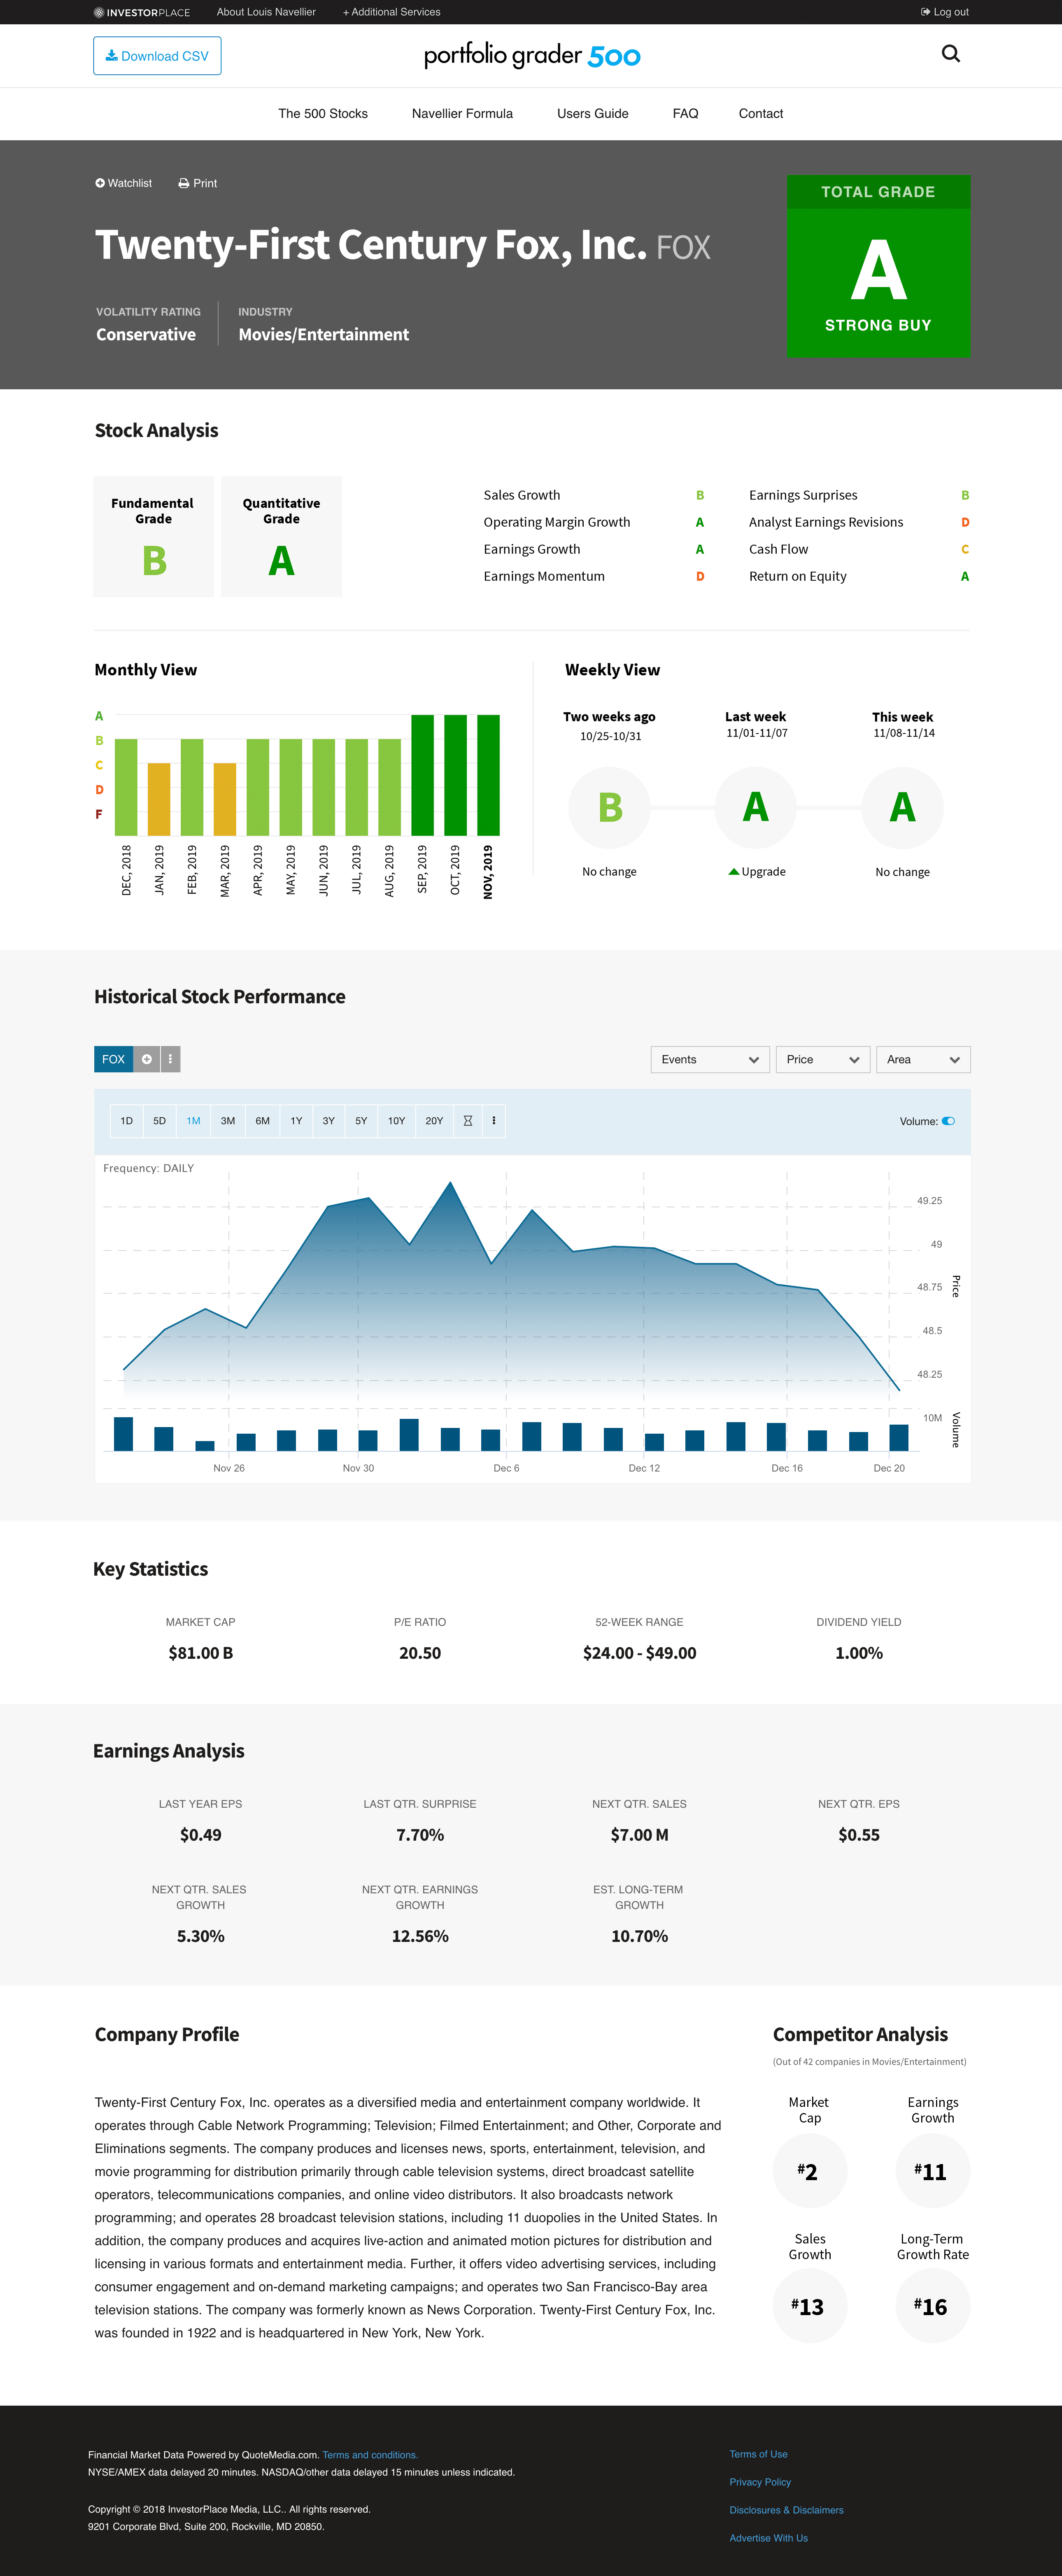
Critical elements of the stock report have been preserved and enhanced for improved usability. The layout has been reorganized into easily digestible sections, while the stock performance chart is now dynamic, allowing users to customize it according to their preferences. Refinements to the color palette, typography, and whitespace create a modern and clean layout, facilitating seamless navigation for users.
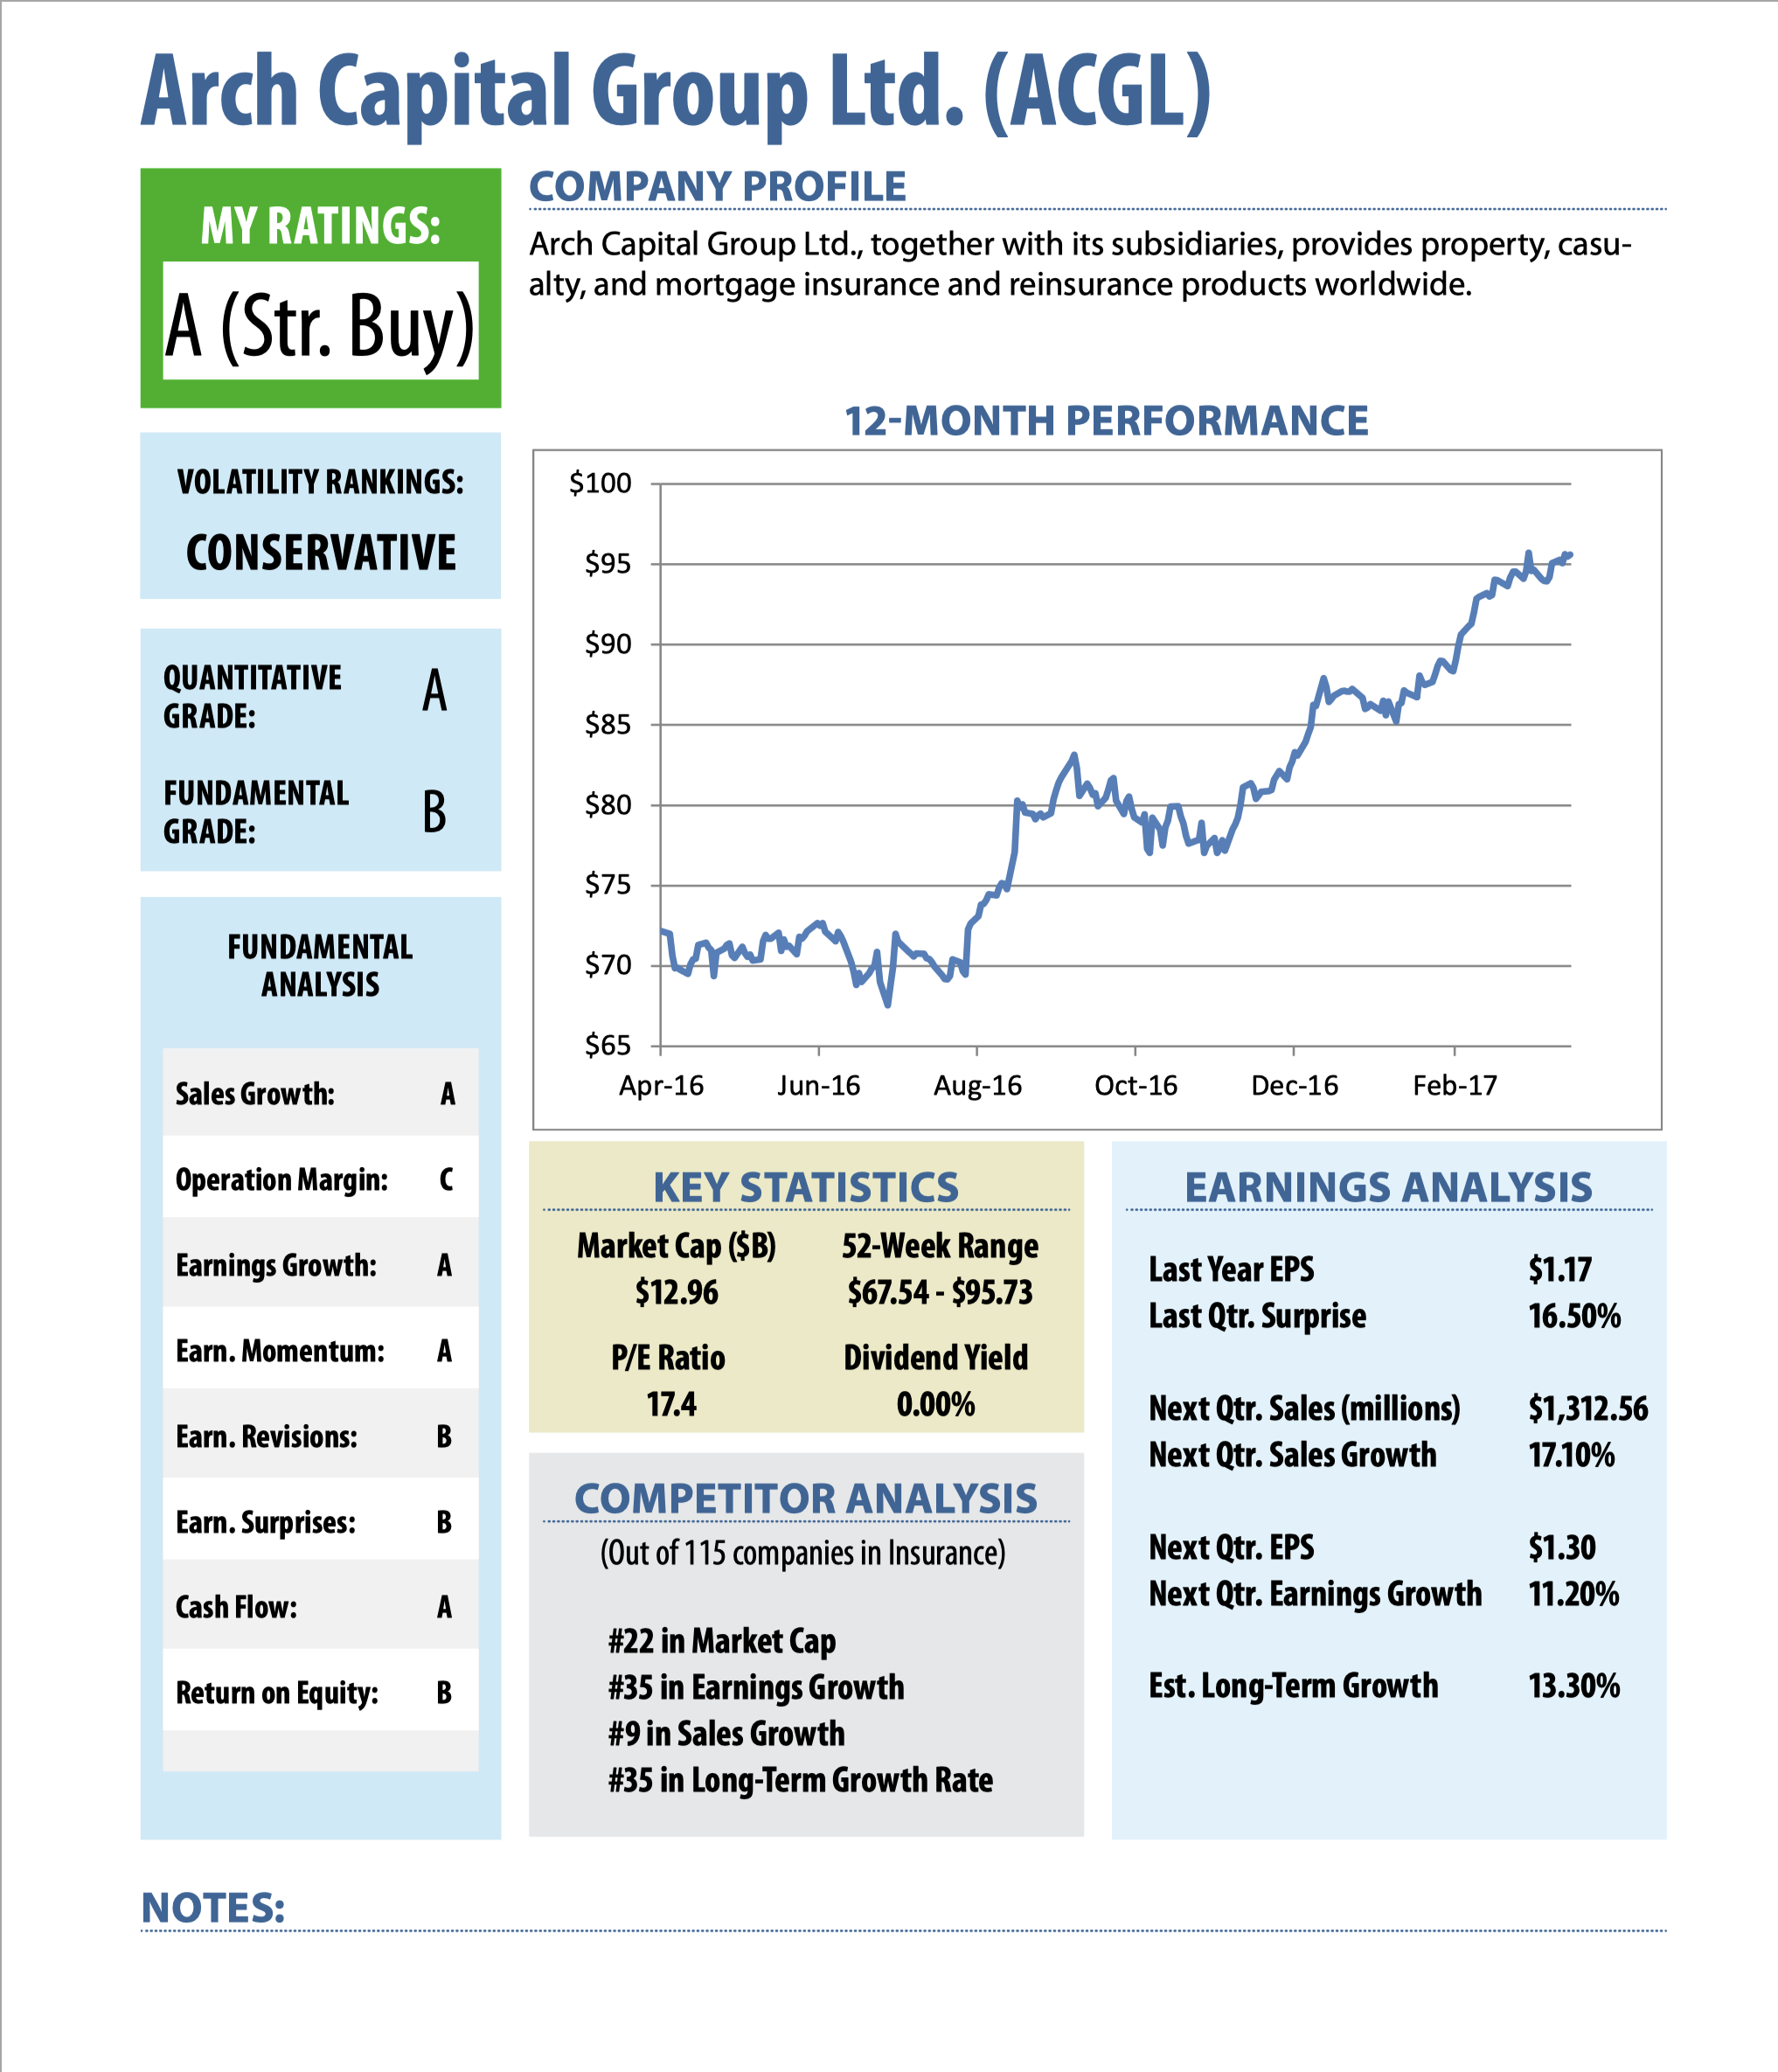
The PDF version of 'Stock Reports' page
©2024 Insun Lee All rights reserved.